Download
1 / 38
380 likes | 531 Views
Temporal Trend in Anthropogenic Sulfur Aerosol Transport from Central and Eastern Europe to Israel. Arnon Karnieli The R emote S ensing L aboratory Jacob Blaustein Institute for Desert Research Ben-Gurion University of the Negev. Aerosol Size Distribution.

E N D
Temporal Trend in Anthropogenic Sulfur Aerosol Transport from Central and Eastern Europe to Israel Arnon Karnieli The Remote Sensing Laboratory Jacob Blaustein Institute for Desert Research Ben-Gurion University of the Negev
Aerosol Size Distribution The two groups tend to differ in their: • Origin • Chemical composition; • Optical properties; • Transport distance; • Deposition rate; • Transformation mechanisms.
From Gas to Aerosol Sulfate (SO42−) Sulfur dioxide (SO2) Sulfuric acid (H2SO4) After combustion of the fossil fuels in the power plants, the sulfur dioxide is converted via a complex series of chemical reactions in the atmosphere to sulfuric acid and sulfate aerosols. The lifetime of sulfur in the atmosphere ranges from 12 hours to 6 days.
SO2 in Europe Temporal trends of sulfur dioxide emissions in Europe 57 Tg 20 Tg (sources: Vestreng et al., 2008)
SO2 Sources 1990 West Europe East Europe Former USSR 12.47 Tg 29.05 Tg 23.52 Tg Source: EDGAR (http://www.mnp.nl/edgar/)
SO2 Sources 2000 West Europe East Europe Former USSR 10.00 Tg 14.56 Tg 14.13 Tg Source: EDGAR (http://www.mnp.nl/edgar/)
Trends by Countries The most industrial countries % decline 1999 - 2004 Source: EDGAR (http://www.mnp.nl/edgar/)
Hypothesis and Objectives Hypothesis The temporal trend of reduction in SO2 emissions in central and eastern Europe after 1991 results in a similar trend in sulfate levels in Israel as a receptor site. Objective To verify the hypothesis using several independent long-term aerosol datasets.
Methodology • This hypothesis was examined by five independent long-term analyses – • Processing of satellite images; • Aerosol optical thickness and relative aerosol size analyses; • Calculations of the radiative forcing; • Analysis of aerosol samples; • Airmass backward trajectories analysis. • The study was restricted to the summer season thus only dry sulfate particles are involved rather than the removal of sulfate from the atmosphere by wet deposition.
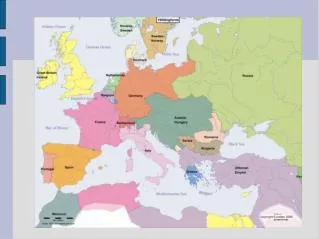
Source and Sink Areas Source Sink Central & East Europe Sede Boker Campus
Summer Synoptic Map High Low
MODIS-Derived AOT Aerosol Optical Thickness Fine mode fraction
Spaceborne Aerosol Optical Thickness (July – August)
AERONET AERONET Sede Boker site AERONET Worldwide sites
Aerosol sampler Sampling: “Gent” PM10 Staked Filter Unit (SFU): - Coarse fraction (2.5-10µm) - Fine fraction (< 2.5µm)
S Airmass Backward Trajectories • 5-days • Max 4,000 m • 1995 – 2004 • 87 events • Threshold S > 3 μg m-3
Conclusions (1) • The study confirmed the hypothesis thatthe temporal trend of reduction in SO2 emissions in central and eastern Europe after 1991 results in a similar trend in sulfate levels in Israel as a receptor site. • This conclusion is based on several independent long-term aerosol datasets.
Israel 1990 1995 2000 370.4 Gg 447.7 Gg 280.7 Gg 60% increase between 1990 to 2000! Source: EDGAR (http://www.mnp.nl/edgar/)
Conclusion (2) Sede Boker site is not affected by aerosols originated in the Israeli coastal zone and can be served as a background station.
Thank You! and special thanks to: Yevgeny Derimian, Rodica Indoitu, Natalya Panov, Robert C. Levy, Lorraine A. Remer, Willy Maenhaut and Brent N. Holben
10 events < 500 m 26 events < 1000 m 61 events < 2000 m 87 events < 4000 m
Single Scattering Albedo (SSA) SAA is a measure of the amount of aerosol light extinction due to scattering Anthropogenic aerosols Mineral dust
Single Scattering Albedo (August)
Synoptic map Mean June-September 1000 hPa height contours Source: Alpert et al. 1990
Trends by regions Source: EDGAR (http://www.mnp.nl/edgar/)