Download
1 / 31
310 likes | 531 Views
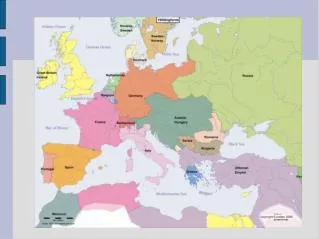
Central and Eastern Europe (CEE). A new business environment. 2004 enlargement. One of most significant events in EU history 10 new member states Population up 20% Area increased by 26% GDP up only 5% What are implications for EU and for business?. Characteristics of CEE.

E N D
Central and Eastern Europe (CEE) A new business environment
2004 enlargement • One of most significant events in EU history • 10 new member states • Population up 20% • Area increased by 26% • GDP up only 5% • What are implications for EU and for business?
Characteristics of CEE • diverse population - culturally and ethnically • low tech and productivity – changing • poor quality infrastructure • low costs and wages • relatively low income/head but skilled labour
Employment costs – annual average full-time male Source: Mercer Human Resource Consulting, Press release 4 April 2005
Rationale for EU enlargement • Cultural/geographical – part of Europe • Mutual economic and political gains • Internal gains: • Economic: larger SEM, better policy co-ordination • Security: alliance building with former Cold War enemies - containing Russia? • Political: extension of market orientated pluralist democracy into former bastions of communism. • External gains: • Enhanced regional role for EU and greater weight in international affairs (eg trade negotiations)
Why join the EU? • Alternatives? • EU - dominant and successful regional framework - market access and assistance • Coincidence of requirements of transition and enlargement - i.e. facilitate the process of modernisation • Membership - able to influence EU law and policy • Globalisation - membership of world’s largest trading bloc
The legacy of communism Micro-economic problems: • Absence of market mechanisms • inefficient resource allocations. • Sectoral imbalances • over-development of heavy industries • under-development of consumer goods industries. • Environmental problems • Bureaucratic legal/administrative structures • Apathy- absence of competitive forces
(continued) Macro-economic problems: • Repressed inflation via wage and price controls • Monetary policy - often a reliance on foreign debt • Inappropriate patterns of investment • Hidden/disguised unemployment MASSIVE PROGRESS TO DATE IN OVERCOMING ABOVE PROBLEMS
Challenges of enlargement to European business • Enlarges SEM • opportunities from supplying a larger market. • CEE fast growing market for consumer and industrial products • CEE share of extra-EU exports in 1983= 7% , by 1997 = 15.3% • Competition: Inter-industry or intra-industry trade? • Eg Hungary -intra-industry trade ratio 61% 1994 but only 50% 1990. BUT • Growth in inter-industry trade more evident (labour intensive and lower value-added production). • Relocation of industry to CEECs ?
What does EU enlargement mean for Growth Trade Investment Jobs For the EU?
Growth • After traumatic falls of early 1990s, 2004 accession states growing faster than EU(15) but: • Real GDP in several still below that of 1989 • i.e. much catching up to do
Transition period GDP growth(2004 average CEE and Baltics = 5%)
Real GDP in 2003 (1989=100) Source: EBRD, 2004 Transition Report
Trade • Growth of intra-industry trade • First half of 1990s – massive shift in CEE trade towards the EU • Trend continues albeit at lower rate • Opportunities for both eastern and western traders • e.g. capital goods from the West • Untapped markets in the east • Low cost advantages for the east in the west
Investment • Opportunities: low cost production, privatisations, skilled workforces and emerging local markets. • government incentives to inward investing firms • cumulative FDI inflows 1989-2003 - $147.5 bn • Est. inflows of $14.8 bn in 2004 • Big difference between countries – e.g. since 2003, Slovenia is net exporter
Cumulative FDI per capita, $US, 1989-2004 Source: EBRD, 2005 Transition Report
Trade and investment example The motor industry
Motor industry • 1989–9 - CEE companies produced over 3 mn cars for local market – not suitable for export • EU motor industry – integrated, transnational industry before SEM • Transition and accession – extends transnational European motor industry (econ. of scale and minimum efficient size) eastwards • CEE provides • markets • Platform for exports • 1988-92 - 2% of EU car imports by volume • 1992-5 rose to 7% • Mid-2000s - about 15% • Since 1990 – all major European automotive investment in CEE - competition for investment
CEE motor industry benefited from: • Qualified and low cost labour force – problems with inflexibility Labour costs in the motor industry – end 2004 Source: Derived from Revue Elargissement, Dossier 52 – March 2005
Strong regional demand • Lower car ownership rates • Older stock – 12-13 years vs8 years (EU15)
Proximity to West European markets • Links with related industries – e.g. materials and components • Slovakia • 2006 to become world’s largest car producer in terms of cars per capita • At transition – produced no cars – 2006 will produce 800,000 plus • Car production – 20% industrial production; 17% GDP and 25% exports • Location: market and at centre of emerging auto cluster
VW Skoda - since 1991 • Greenfield investment - longer to take root • Limited joint venture - brownfield opportunities: VW quickly took advantage – Skoda in Czechoslovakia • Initial reputation for poor quality and reliability • 1991 VW took 30% stake in Skoda • 2000 VW took last of government’s stake in VW • VW sees Skoda as platform for CEE and Russia and Asia entry • Largest auto producer in CEE - output tripled • Consistent 50-55% of domestic market • Skoda’s image transformed
Spillovers - within 5 years, VW Skoda had stimulated 52 joint ventures & 38 greenfield suppliers • Largest sales revenue of any Czech company, • Czech number one exporter (10% of all Czech exports - auto components a further 5%) - exports 52% of sales 1995 - approaching 80%; 64 markets -
Leading industrial employer - plants and domestic supply chain employ 150,000 (4% Czech workforce) • Helped integrate Czech component manufacturer into global automotive sourcing • Some differentiation from VW cars - but many VW qualities at lower price
Jobs • Low wages in CEE leads to competitive advantage over EU-15 • Investment effect • Downward pressure on wages elsewhere in EU • Migration effects? • Will CEE advantage disappear over time?
For the EU? • New balance of power? • Institutional pressure • Extension of SEM • Few policies unaffected
The Future • Future members: • Bulgaria and Romania - 2007 • Turkey - date unknown • Croatia • other former Yugoslav republics? • Others?