Download
1 / 57
580 likes | 770 Views
System Design and Performance Overview. nano LC. nano MDLC. ht LC. nano LC. Nanoscale binary gradient chromatography No flow splitting and dynamic flow control Additional loading pump for high speed sample loading and de-salting. Nano-Flow HPLC. Active flow control of each mobile phase

E N D
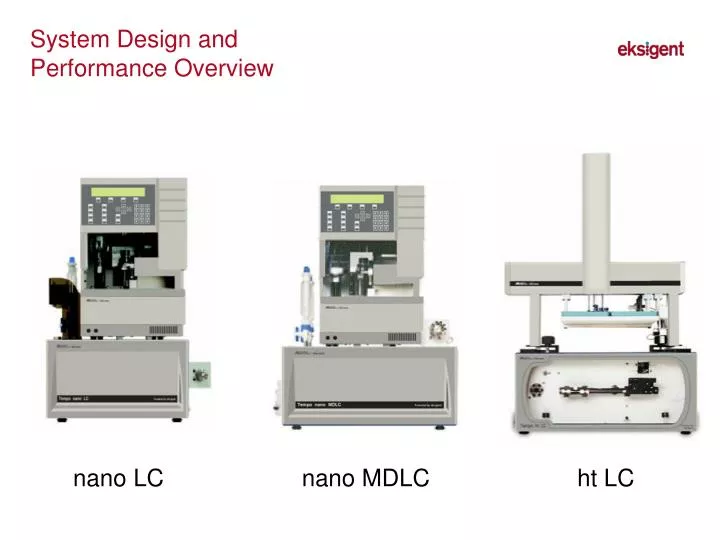
System Design and Performance Overview nano LC nano MDLC ht LC
nano LC • Nanoscale binary gradient chromatography • No flow splitting and dynamic flow control • Additional loading pump for high speed sample loading and de-salting
Nano-Flow HPLC • Active flow control of each mobile phase • Measurement of flows with active feedback • Accounts for changes in viscosity and back pressure in the separation column • No flow splitting • Direct measurement of column flow and back pressure • Reductions in mobile phase preparation and disposal • Rapid system response • Prompt step changes in flow or composition • High flow loading/washing and “peak parking” integral to system
Repeated Injections of BSA digest: chromatograms and column pressures • BSA tryptic digest • 150 x 0.075 mm 5um ProteoPep2 C18 column • water/acetonitrile gradient with 0.1% formic acid • 250 nL/min gradient • column back pressure shows run to run conditions of column
Dynamic Flow Control for Peak Parking • Rapid flow rate reduction (500-50 nL/min) • Gradient profile resumed after parking • Parking flow can be set at any rate • No additional hardware or plumbing • Triggered within software or by external trigger
Gradient separation of Cytochrome c tryptic digest Col: 150 x 0.100 mm m 3 m C18 Inj: 100 nL Flow rate: 300 nL/min Park rate: 50 nL/min Peak parking example PARK 214 nm Absorbance 0 5 10 15 20 25 Time (min)
XIC of +EPI: Exp 3, 784.0 to 784.9 amu Max. 3.8e6 cps. NO Peak Parking Intensity, cps < 30 sec 0.0 1 2 3 4 5 6 7 8 9 10 11 12 13 14 15 16 Time, min XIC of +EPI: Exp 3, 784.1 to 785.1 amu Max. 9.5e6 cps. Peak Parking Activated > 1.5 min Intensity, cps 0.0 1 2 3 4 5 6 7 8 9 10 11 12 13 14 15 16 Time, min Phosphopeptide Identification with Peak Parking • Mixture of a and b casein with BSA tryptic digests • Q-Trap triple quadrupole with linear trap • Neutral loss (49 amu) survey scan to identify phosphopeptides • Peak parking from 500 nL/min to 50 nL/min activated by MS software when NL detected
Increased Phosphopeptide ID with Peak Parking a-casein and its phosphopeptides identified with peak parking * Neutral Loss of 49 was used to target doubly charged phosphopeptides specifically
nano MDLC • Dual binary gradient chromatography (4 pumps) • 20 – 1000 nL/min • 1 – 20 microL/min • No flow splitting and dynamic flow control
Rapid Sample loading on parallel traps to increase throughput of dilute samples
Rapid Sample Loading Data 1st trap: rapid sample load 2nd trap: loaded while 1st trap elutes • 5 mL of BSA tryptic digest loaded at 5 mL/min • 0.5mm x 2 mm CapTrap (Michrom) • eluted at 500 nL/min onto 150mm x 0.1mm C18 analytical column • 5 mL of BSA tryptic digest loaded at 500 nL/min • 0.3mm x 5 mm PepMap C18 trap (LC Packings) • eluted at 500 nL/min onto 150mm x 0.1mm C18 analytical column
Microfluidic Flow Control Technology • Flow meters in each mobile phase measure the actual flow rate • Active Flow Control uses feedback to control a rapid, electronically adjusted variable pressure source • Flow rate is maintained regardless of system back pressure or viscosity • Binary system includes dual controllers
1 nL/min step 2 nL/min step Accurate Flow Control
ExpressLC • Fast gradient chromatography • 2-30 microL/min • Optimized for 300 micoL columns • Direct real-time flow control • Very fast, highly reproducible gradients
ht LC System Layout CTC autosampler- various versions integrated with system Temperature controlled column holder Integrated injection system- software selectable, delivers precise injection volumes from 10 nl to 1 ul Microfabricated flow cell with array-based UV absorbance from 200 – 380 nm
ht LC Instrument Design • Direct pumping system with precision flow control • Reduce instrumental variance to achieve highest performance allowed by column • Instrumental variance includes • Injection (dispersion of “plug”) • Connection tubing • Dispersion from fittings/connectors • Detection cell s2 = scol2 + sinj2 + stube2 + sfittings2 + sdet2
15,000 13,500 12,000 10,500 9,000 7,500 s2=150 s2=1000 s2=500 s2=2000 • Plates Assumptions 15,000 plates s2col = 3700 nL2 s2=3700 K’ Loss in Efficiency Due to System Dispersion for 150 x 0.3 mm Column
60nl from variable injector Time-Sliced Injections Provide Low Variance 60nl fixed internal loop
Variation of Injection Time / Volume 540 nL/min
Linear Variation of Injection Volumes using Timed Injections Flow rate: 4.0 mL/min Duplicate injections for each volume
Low Dispersion / High Sensitivity Detection Cell • Chip-based flow cell • 200-380 nm array detection • Fiber optic coupling • 4 mm pathlength, 45 nL detection cell • Each separation column will have independent detection cell and detection array
Dual Beam Spectrometer Performance • Temperature-controlled detector arrays and light source • Methods developed for stable fiber illumination and transmission • Typical drift £ 0.4 mAU/hr • Typical short-term noise £ 0.04 mAU rms
Detection Cell Variance Time [s] 0 5 10 15 20 25 30 Eksigent : ~300 nL2 LC Packings : ~6500 nL2 Eksigent 45 nL Flow Cell Absorbance LC Packings 45 nL Flow Cell 0 500 1000 1500 Volume [nL]
Eksigent Microfabricated UV Flow Cell Provides Excellent Linearity
High Resolution: Isocratic Separation Column: Zorbax 300XDB-C18 3.5 mm 150 x 0.3 mm Mobile Phase: A: H2O B: ACN Gradient: Isocratic 30% A : 70% B Flow Rate: 4 mL/min Injection: 40 nL Sample: 1. Uracil 2. Acetophenone (19000) 3. Propiophenone (20300) 4. Butyrophenone (19700) 5. Valerophenone (19600) 6. Hexanophenone (19400) 7. Heptanophenone (19500)
Near Theoretical Efficiencies Small C-term allows fast analysis
High Resolution Gradient Separation Column: Zorbax 300XDB-C18 3.5 mm 150 x 0.3 mm Mobile Phase: A: H2O B: ACN Gradient: Gradient 20 80% in 15 min Flow Rate: 6 mL/min Injection: 40 nL Sample: 1. Uracil 2. Acetophenone 3. Propiophenone 4. Butyrophenone 5. Valerophenone 6. Hexanophenone 7. Heptanophenone
Method 2 Time (min)A (mL/min)B (mL/min) 0 16 0.8 0.25 0.08 24 0.7 0.08 24 Rapid Gradient Separations
Chromatographic Hydrophobicity Assay Acetophenoe 5-phenyl-1H-tetrazole Butyrophenone Colchicine Valerophenone Propiohenonee Indole Theophylline
2400 1900 1400 Absorbance Mixing Gradient Reset and Re-equilibration 900 500 ul 30 sec Conventional 6 min 3 min 2.5 min 400 300 nl 2 sec ExpressLC -100 0 1 2 3 4 5 6 7 1.5 min 28 sec 1 min Time (min) Reduction of Analysis Time
Ten Assays in 15 Minutes Retention Time 2% 98% B in 45 sec. , hold 15 seconds, pre-run flush 30 sec. A : 10 mM Ammonium Acetate pH 7.4 B : 10 mM AA/ACN 14 microL/min; 40 nL inject
Simple Method Transfer with Increased Gradient Speed Gradient is both reproducible and linear
A stir diffuse t-dispersive B tb td Anatomy of a Fast Gradient g(t) tb = 2 td’ • The delivered gradient is a function of delay volume and system blur • Re-equilibration also requires a similar transition • Therefore the delay occurs 2 times per analysis tb = 0 td=td’+tb stir & diffuse mix mobile phase t td’ tb
System Comparisons • Vdelay divided by Vcolumn provides a relative comparison of delay times between different systems- data is normalized for column diameter • Delay volumes based on manufacturer specifications • Data below are for a 5 cm column Compared to Eksigent, next best system is 9X worse in relative delay.
Analysis of Buspirone Metabolites LC/MS/MSExpressLC / API 2000 • Column: Zorbax SB C18, 3.5 mm, 0.30 x 50 mm • Flow rate: 10 mL/min. • Gradient: Multi-step • A: Water / 0.1 % Formic Acid • B: ACN / 0.06% Formic Acid Time (min)%B 0 5 0.1 5 0.6 25 1 60 1.1 98 1.4 98
MS Method • Parameters • CUR: 10 • GS1: 10 • GS2: 20 • IS: 5000 • TEM: 150 • ihe: ON • CAD: 8 • DP: 80 • EP: 10 • CE: 50 • CXP: 5 • MS: AB/MDS Sciex API2000 • Ionization mode: Turbo Spray with 150 mm OD / 30 mm ID capillary inserted through spray tip. • Polarity: Positive
ExpressLC / API 2000 using Zorbax 1.8 micron C18 Time (min)%B 0 20 0.1 35 1.1 50 1.3 98 1.9 98 Zorbax 1.8mm C18 50 x 0.3 mm
Long Term Repeatability Gradient Separations • Column: Aquasil C18, 5 mm, 0.320 x 50 mm • Column temperature: 30 C • Flow rate: 12 mL/min • Gradient: 30-95% in 1 minute • A: Water (0.1% formic acid) • B: Acetonitrile (0.1% formic acid) • Injection: 80 nL • Samples diluted in 70/30 water/acetonitrile • Detection: 300 nm @ ~ 5 Hz data collection rate • Sample: compound in TPG5/Water • Each sample was injected 250 times
System Repeatability: 250 Injections 200 100 Injection # 10
Retention time RSD = 0.19 % Retention Time: 250 Injections
Area RSD = 0.72 % Peak Area: 250 Injections
Reserpine Dioctyl Phthalate Aspartame Cortisone 200 µg/mL Test System Linearity on Pfizer Test Mix Column: Zorbax C18 300SB 3.5 mm 50 x 0.3 mm Mobile Phase: A: H2O (0.05% TFA) B: ACN (0.04% TFA) Gradient: Gradient 2% 98% B in 3 min Flow Rate: 6 mL/min Injection: 40 nL