Download
1 / 17
170 likes | 345 Views
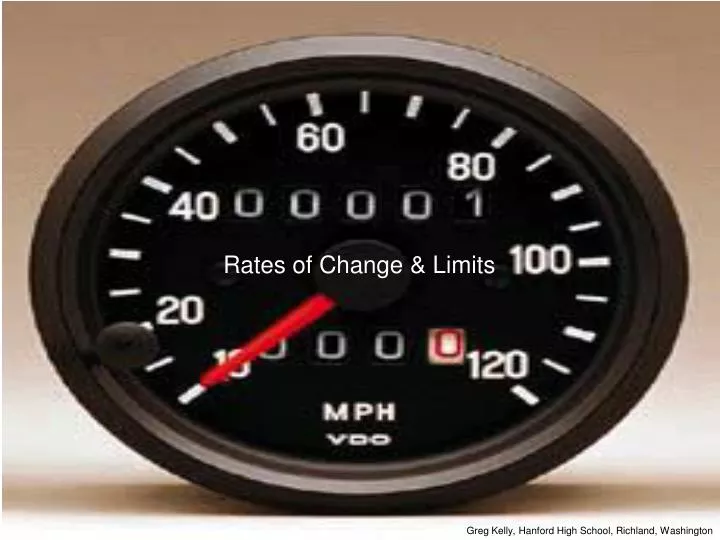
Rates of Change & Limits. Greg Kelly, Hanford High School, Richland, Washington. Then your average speed is:. Suppose you drive 200 miles, and it takes you 4 hours. If you look at your speedometer during this trip, it might read 65 mph. This is your instantaneous speed.

E N D
Rates of Change & Limits Greg Kelly, Hanford High School, Richland, Washington
Then your average speed is: Suppose you drive 200 miles, and it takes you 4 hours. If you look at your speedometer during this trip, it might read 65 mph. This is your instantaneous speed.
A rock falls from a high cliff. The position of the rock is given by: After 2 seconds: average speed: What is the instantaneous speed at 2 seconds?
for some very small change in t where h = some very small change in t We can use the TI-83+ to evaluate this expression for smaller and smaller values of h.
1 80 0.1 65.6 .01 64.16 .001 64.016 64.0016 .0001 .00001 64.0002 We can see that the velocity approaches 64 ft/sec as h becomes very small. We say that the velocity has a limiting value of 64 as h approaches zero. (Note that h never actually becomes zero. We aren’t allowed to divide by zero!)
0 The limit as h approaches zero:
Consider: What happens as x approaches zero? Graphically:
Numerically: Set TBLSET so that TblStart=-0.003 and DTbl=.001 It appears that the limit of Y1 approaches 1 as h approaches zero
“The limit of fof x as x approaches c is L.” Limit notation: So:
The limit of a function refers to the value that the function approaches, not the actual value (if any). not 1
Properties of Limits: Limits can be added, subtracted, multiplied, multiplied by a constant, divided, and raised to a power. (See page 58 for details.) For a limit to exist, the function must approach the same value from both sides. One-sided limits approach from either the left or right side only.
does not exist because the left and right hand limits do not match! left hand limit right hand limit value of the function 2 1 1 2 3 4 At x=1:
because the left and right hand limits match. left hand limit right hand limit value of the function 2 1 1 2 3 4 At x=2:
because the left and right hand limits match. left hand limit right hand limit value of the function 2 1 1 2 3 4 At x=3:
Show that: The maximum value of sine is 1, so The minimum value of sine is -1, so So: The Sandwich Theorem: