Download
1 / 7
70 likes | 150 Views
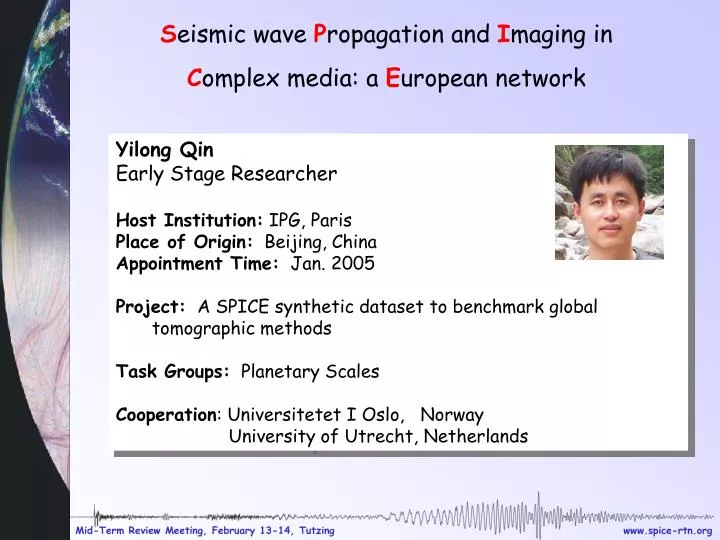
S eismic wave P ropagation and I maging in C omplex media: a E uropean network. Yilong Qin Early Stage Researcher Host Institution: IPG, Paris Place of Origin: Beijing, China Appointment Time: Jan. 2005 Project: A SPICE synthetic dataset to benchmark global tomographic methods

E N D
Seismic wave Propagation and Imaging in Complex media: a European network • Yilong Qin • Early Stage Researcher • Host Institution: IPG, Paris • Place of Origin: Beijing, China • Appointment Time: Jan. 2005 • Project:A SPICE synthetic dataset to benchmark global tomographic methods • Task Groups: Planetary Scales • Cooperation: Universitetet I Oslo, Norway • University of Utrecht, Netherlands
Project ScopeBenchmark global surface-wave tomography The different existing global tomographic methods result in different models of the Earth. To interpret the structure images in terms of the associated physical processes, it is important to understand in a quantitatively way the resolving properties of specific algorithms. Within SPICE project, we have decided to perform a benchmark experiment of global inversion algorithms using complete 3D synthetic seismograms for anisotropic model The goal is to test how current imaging techniques are limited by approximations in theory and the inadequacy of data quality and coverage. Our set of synthetic seismograms will be made available to the community worldwide
Main Results Bench of benchmark:To make sure that the computation precision, data format, sampling rate, event and receiver distribution and etc are enough good for tomography test, we first construct one simple isotropic global model by inserting eight cylinders smoothly into the 1D earth model. Realistic Stations distribution (256) Realistic distribution of 27 sources Comparison between SEM and Normal modes to determiner the mesh Comparison of seismogram between 3D model (red) and reference 1D model (black) for Event 9 and station FFC Velocity anomaly model
Main Results Inversion results(Sergei Lebedev and Jeannot Trampert) The coverage of minor-arc paths Velocity model (Depth-independent) The inversion velocity anomalies at 70km The inversion velocity anomalies at 670km
Outlook To fully validate methods with a challenging synthetic dataset where the true model is known, The final 3D anisotropic model consists 10 parameters (P-wave isotrpic average velocity, S-wave isotropic average velocity, Density, quality factor(Qmu), anisotropic parameter for vertically transverse anisotropic (xi, phi and eta) and the orientation of the crystal. The synthetic seismograms were generated using the Coupling Spectral Elements and Modal (CSEM)Solution The 3D anisotropic model consists of: (1) the reference 1-D model consists of 6 layers which corresponds to D’’, lower lower mantle, upper lower mantle, transition zone, upper mantle and crust. (2) Deterministic parts (3) Random partsare defined as spherical harmonic component. (5) Filtered existing crustal model The final datasets: (1) Add noise to the seismgrams (2) Minimum period 25s (3) Not provide the accurate source moment tensor and location Comparison between 100s, 50s and 25s seismograms
Outlook We are doing now: 1. Incorporating the subroutine of 3D anisotropic model into the SEM designing the mesh, and then begin to compute the final benchmark datasets 2. Global Waveform tomography using SEM (1) Calculate partial derivative using normal modes (2) Forward moleliing using CSEM (3) Using great earthquake (Ms=8.0), about 33 events (3) Invert 150s long-period seismogram