Download
1 / 30
300 likes | 306 Views
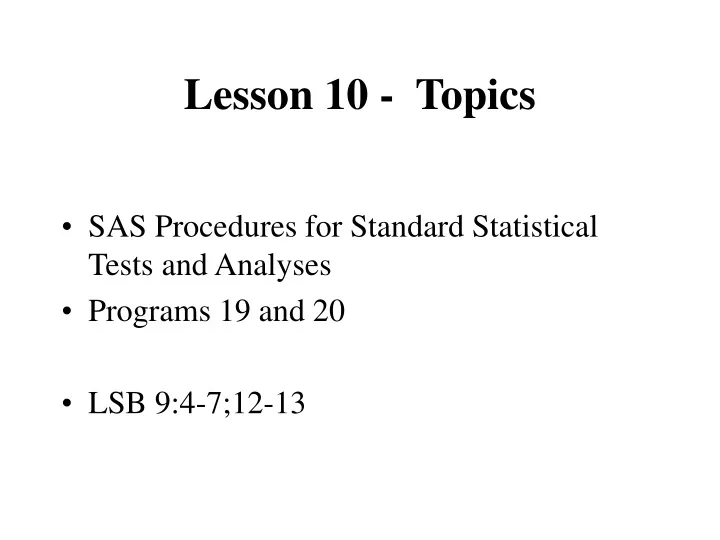
Lesson 10 - Topics. SAS Procedures for Standard Statistical Tests and Analyses Programs 19 and 20 LSB 9:4-7;12-13. STATISTICAL PROCEDURES IN SAS. STATISTICAL PROCEDURES IN SAS. Important to understand the output. Treatment Groups in TOMHS 1. Beta Blocker 2. Calcium Channel Blocker

E N D
Lesson 10 - Topics • SAS Procedures for Standard Statistical Tests and Analyses • Programs 19 and 20 • LSB 9:4-7;12-13
STATISTICAL PROCEDURES IN SAS Important to understand the output
Treatment Groups in TOMHS 1. Beta Blocker 2. Calcium Channel Blocker 3. Diuretic 4. Alpha Blocker 5. ACE Inhibitor 6. Placebo 1 - 5 are blood pressure drugs
Side Effect Questions Have you been troubled in the past 3 months with any of the following? a. Fever b. Sweating ww. Feeling depressed 1. No, not troubled 2. Yes, mildly 3. Yes, moderately 4. Yes, severely Responses 2-4 indicate a positive response.
* Program 19 DATA stat ; INFILE‘C:\SAS_Files\tomhsfull.data' LRECL = 300 ; INPUT @1 ptid $10. @25 group 1. @115 sbpbl 3. @123 sbp12 3. @76 ursod12 3. @278 se12_2 1. ; if se12_2 in(2,3,4) then tired12 = 1; else if se12_2 = 1then tired12 = 2; sbpchg = sbp12 - sbpbl; if group = 6then active = 2; else active = 1; if group IN(1,2,3,4,5) then drug = group;
PROCFREQDATA=stat; TABLES active*tired/CHISQ RELRISK; TITLE'Chi-square Test Comparing Active vs Placebo Group for Tiredness'; RUN; CHISQ – displays Chi-square test RELRISK – displays odds ratio and relative risk Indepent Variable * dependent variable
Table of active by tired12 active tired12 Frequency‚ Percent ‚ Row Pct ‚ Col Pct ‚ 1‚ 2‚ Total ƒƒƒƒƒƒƒƒƒˆƒƒƒƒƒƒƒƒˆƒƒƒƒƒƒƒƒˆ 1 ‚ 112 ‚ 522 ‚ 634 ‚ 13.04 ‚ 60.77 ‚ 73.81 ‚ 17.67 ‚ 82.33 ‚ ‚ 67.07 ‚ 75.43 ‚ ƒƒƒƒƒƒƒƒƒˆƒƒƒƒƒƒƒƒˆƒƒƒƒƒƒƒƒˆ 2 ‚ 55 ‚ 170 ‚ 225 ‚ 6.40 ‚ 19.79 ‚ 26.19 ‚ 24.44 ‚ 75.56 ‚ ‚ 32.93 ‚ 24.57 ‚ ƒƒƒƒƒƒƒƒƒˆƒƒƒƒƒƒƒƒˆƒƒƒƒƒƒƒƒˆ Total 167 692 859 19.44 80.56 100.00 Frequency Missing = 43 Statistic DF Value Prob ƒƒƒƒƒƒƒƒƒƒƒƒƒƒƒƒƒƒƒƒƒƒƒƒƒƒƒƒƒƒƒƒƒƒƒƒƒƒƒƒƒƒƒƒƒƒƒƒƒƒƒƒƒƒ Chi-Square 1 4.8725 0.0273 Likelihood Ratio Chi-Square 1 4.6977 0.0302 Continuity Adj. Chi-Square 1 4.4493 0.0349 Mantel-Haenszel Chi-Square 1 4.8668 0.0274 Tests if two percentages are significantly different P-value
Table of active by tired12 active tired12 Frequency‚ Percent ‚ Row Pct ‚ Col Pct ‚ 1‚ 2‚ Total ƒƒƒƒƒƒƒƒƒˆƒƒƒƒƒƒƒƒˆƒƒƒƒƒƒƒƒˆ 1 ‚ 112 ‚ 522 ‚ 634 ‚ 13.04 ‚ 60.77 ‚ 73.81 ‚ 17.67 ‚ 82.33 ‚ ‚ 67.07 ‚ 75.43 ‚ ƒƒƒƒƒƒƒƒƒˆƒƒƒƒƒƒƒƒˆƒƒƒƒƒƒƒƒˆ 2 ‚ 55 ‚ 170 ‚ 225 ‚ 6.40 ‚ 19.79 ‚ 26.19 ‚ 24.44 ‚ 75.56 ‚ ‚ 32.93 ‚ 24.57 ‚ ƒƒƒƒƒƒƒƒƒˆƒƒƒƒƒƒƒƒˆƒƒƒƒƒƒƒƒˆ Total 167 692 859 19.44 80.56 100.00 Estimates of the Relative Risk (Row1/Row2) Type of Study Value 95% Confidence Limits ƒƒƒƒƒƒƒƒƒƒƒƒƒƒƒƒƒƒƒƒƒƒƒƒƒƒƒƒƒƒƒƒƒƒƒƒƒƒƒƒƒƒƒƒƒƒƒƒƒƒƒƒƒƒƒƒƒƒƒƒƒƒƒƒƒ Case-Control (Odds Ratio) 0.6632 0.4598 0.9565 Cohort (Col1 Risk) 0.7227 0.5437 0.9606 OR = Odds of tiredness (Active v Placebo) OR = (112/522)/(55/170) = 0.66 RR = Risk of tiredness (Active v Placebo) RR = 17.67/24.44 = 0.72
PROCTTESTDATA=stat; VAR sbpchg; CLASS active; TITLE'T Test Comparing Active vs Placebo Group for Change in Blood Pressure'; RUN; Testing if mean SBP change is equal between 2 groups.
Statistics Lower CL Upper CL Lower CL Variable active N Mean Mean Mean Std Dev Std Dev sbpchg 1 627 -19.44 -18.35 -17.26 13.19 13.92 sbpchg 2 221 -12.28 -10.38 -8.473 13.129 14.354 sbpchg Diff (1-2) -10.13 -7.972 -5.817 13.396 14.034 Statistics Upper CL Variable active Std Dev Std Err Minimum Maximum sbpchg 1 14.736 0.5559 -75 28 sbpchg 2 15.833 0.9656 -44 30 sbpchg Diff (1-2) 14.736 1.0979 T-Tests Variable Method Variances DF t Value Pr > |t| sbpchg Pooled Equal 846 -7.26 <.0001 sbpchg Satterthwaite Unequal 376 -7.16 <.0001 -7.26 = -7.972/1.0979
PROCMEANSDATA=stat NMEANSTDERR T PRT ; CLASS group; VAR sbpchg; TITLE 'Paired T-Test, Are there significant changes in SBP within each group?'; RUN; Also used for a crossover design where each patient gets each treatment in random order
Analysis Variable : sbpchg N group Obs N Mean Std Error t Value Pr > |t| ƒƒƒƒƒƒƒƒƒƒƒƒƒƒƒƒƒƒƒƒƒƒƒƒƒƒƒƒƒƒƒƒƒƒƒƒƒƒƒƒƒƒƒƒƒƒƒƒƒƒƒƒƒƒƒƒƒƒƒƒƒƒƒƒƒƒƒƒƒƒƒƒƒƒƒ 1 132 126 -19.8095238 1.3655496 -14.51 <.0001 2 131 121 -17.2561983 1.0548020 -16.36 <.0001 3 136 124 -21.5967742 1.3047312 -16.55 <.0001 4 134 129 -15.8294574 1.2368065 -12.80 <.0001 5 135 127 -17.3228346 1.1691084 -14.82 <.0001 6 234 221 -10.3755656 0.9655718 -10.75 <.0001 ƒƒƒƒƒƒƒƒƒƒƒƒƒƒƒƒƒƒƒƒƒƒƒƒƒƒƒƒƒƒƒƒƒƒƒƒƒƒƒƒƒƒƒƒƒƒƒƒƒƒƒƒƒƒƒƒƒƒƒƒƒƒƒƒƒƒƒƒƒƒƒƒƒƒƒ T-value = Mean/Std Error
* Compare 5 active drug groups; * For SBP change; PROCANOVADATA=stat; CLASS drug; * Treat as categories; MODEL sbpchg = drug; MEANS drug/BON ; TITLE'ANOVA Comparing 5 Active Treatment Groups for Change in SBP '; RUN;
The ANOVA Procedure Class Level Information Class Levels Values drug 5 1 2 3 4 5 Number of observations 902 NOTE: Due to missing values, only 627 observations can be used in this analysis.
Dependent Variable: sbpchg ANOVA TABLE Sum of Source DF Squares Mean Square F Value Pr > F Model 4 2673.8672 668.4668 3.51 0.0077 Error 622 118618.3370 190.7047 Corrected Total 626 121292.2041 3.51 = 668.5/190.7 Source DF Anova SS Mean Square F Value Pr > F drug 4 2673.867173 668.466793 3.51 0.0077
Bonferroni (Dunn) t Tests for sbpchg Alpha 0.05 Critical Value of t 2.82 Minimum Significant Difference 4.92 Adjusts for 10 possible pairwise comparisons Required difference between any 2 groups to be significant.
Comparisons significant at the 0.05 level are indicated by ***. Difference Simultaneous drug Between 95% Confidence Comparison Means Limits 4 - 2 1.427 -3.497 6.350 4 - 5 1.493 -3.370 6.356 4 - 1 3.980 -0.893 8.853 4 - 3 5.767 0.875 10.660 *** 2 - 4 -1.427 -6.350 3.497 2 - 5 0.067 -4.875 5.009 2 - 1 2.553 -2.398 7.505 2 - 3 4.341 -0.631 9.312 5 - 4 -1.493 -6.356 3.370 5 - 2 -0.067 -5.009 4.875 5 - 1 2.487 -2.405 7.378 5 - 3 4.274 -0.637 9.185 1 - 4 -3.980 -8.853 0.893 1 - 2 -2.553 -7.505 2.398 1 - 5 -2.487 -7.378 2.405 1 - 3 1.787 -3.134 6.708 3 - 4 -5.767 -10.660 -0.875 *** 3 - 2 -4.341 -9.312 0.631 3 - 5 -4.274 -9.185 0.637 3 - 1 -1.787 -6.708 3.134
PROCGLMDATA=stat; * GLM (General Linear Model) CLASS drug; MODEL sbpchg = drug; ESTIMATE'BB vs Diuretic' drug 10 -100 ; ESTIMATE'CCB vs Diuretic' drug 01 -100 ; ESTIMATE'Alpha B vs Diuretic‘ drug 00 -110 ; ESTIMATE'ACE v Diuretic' drug 00 -101 ; MEANS drug; TITLE‘GLM Comparing 5 Active Treatment Groups for Change in SBP '; RUN; Compares drug 1 with drug 3
The GLM Procedure Source DF Type III SS Mean Square F Value Pr > F drug 4 2673.867173 668.466793 3.51 0.0077 Output from estimate statements Standard Parameter Estimate Error t Value Pr > |t| BB vs Diuretic 1.78725038 1.74684597 1.02 0.3066 CCB vs Diuretic 4.34057585 1.76465673 2.46 0.0142 Alpha B vs Diuretic 5.76731683 1.73674192 3.32 0.0010 ACE v Diuretic 4.27393955 1.74343147 2.45 0.0145 Each group has higher BP than the diuretic group. ESTIMATE‘Avg 2-3 v 4' drug 0-.5 -.510 ;
PROCUNIVARIATEDATA = stat; VAR ursod12; HISTOGRAM ursod12 / NORMALMIDPOINTS=0 to 180 by 2; INSETN = 'N' (5.0) MEAN = 'Mean' (5.1) STD = 'Sdev' (5.1) MIN = 'Min' (5.1) MAX = 'Max' (5.1)/ POS=NW HEADER='Summary Statistics'; LABEL bmi = ‘Urinary Sodium'; TITLE‘Distribution of Urinary Sodium Excretion'; RUN;
PROCNPAR1WAYDATA=stat WILCOXON ; CLASS drug; VAR ursod12; * Skewed distribution; TITLE'Non-parametric Test Comparing Groups in Urinary Sodium'; RUN; *The values for ursod12 are ordered from lowest to highest and given a value of 1 to N. Analyses is then done on these ranked values.
Wilcoxon Scores (Rank Sums) for Variable ursod12 Classified by Variable drug Sum of Expected Std Dev Mean drug N Scores Under H0 Under H0 Score ƒƒƒƒƒƒƒƒƒƒƒƒƒƒƒƒƒƒƒƒƒƒƒƒƒƒƒƒƒƒƒƒƒƒƒƒƒƒƒƒƒƒƒƒƒƒƒƒƒƒƒƒƒƒƒƒƒƒƒƒƒƒƒƒƒƒƒƒ 5 116 31422.50 34974.0 1682.82936 270.883621 3 118 38296.50 35577.0 1693.77858 324.546610 2 120 33286.50 36180.0 1704.53960 277.387500 4 126 40102.50 37989.0 1735.72813 318.273810 1 122 38395.00 36783.0 1715.11595 314.713115 Average scores were used for ties. Kruskal-Wallis Test Chi-Square 9.8522 DF 4 Pr > Chi-Square 0.0430 Of values 1-602 drug N Median ƒƒƒƒƒƒƒƒƒƒƒƒƒƒƒƒƒƒƒƒƒƒƒƒƒƒƒƒƒƒƒƒƒƒƒƒƒƒƒƒƒƒ 1 122 38.5 2 120 36.0 3 118 40.5 4 126 39.5 5 116 36.0 ƒƒƒƒƒƒƒƒƒƒƒƒƒƒƒƒƒƒƒƒƒƒƒƒƒƒƒƒƒƒƒƒƒƒƒƒƒƒƒƒƒƒ
* Program 20 * Chi-square tests from summary counts; DATA asthma; INFILE DATALINES; INPUT ses asthma count; DATALINES; 1 1 40 1 2 100 2 1 30 2 2 130 ; Asthma SES |YES | NO | ---------+--------+--------+ LOW | 40 | 100 | ---------+--------+--------+ HIGH | 30 | 130 | ---------+--------+--------+
SAS LOG 1 DATA asthma; 2 INFILE DATALINES; 3 INPUT ses asthma count; 4 DATALINES; NOTE: The data set WORK.ASTHMA has 4 observations and 3 variables.
PROCFREQDATA=asthma; TABLES ses*asthma/CHISQRELRISK ; WEIGHT COUNT; TITLE'Relationship between Asthma and SES'; RUN; ses asthma Frequency| Percent | Row Pct | Col Pct |1 |2 | Total ---------+--------+--------+ 1 | 40 | 100 | 140 | 13.33 | 33.33 | 46.67 | 28.57 | 71.43 | | 57.14 | 43.48 | ---------+--------+--------+ 2 | 30 | 130 | 160 | 10.00 | 43.33 | 53.33 | 18.75 | 81.25 | | 42.86 | 56.52 | ---------+--------+--------+ Total 70 230 300 23.33 76.67 100.00 Odds Ratio (Relative Odds) (40/100)/(30/130)= 1.73 Note: This is the odds ratio of having asthma (low v high SES)
Statistics for Table of ses by asthma Statistic DF Value Prob ------------------------------------------------------ Chi-Square 1 4.0262 0.0448 Estimates of the Relative Risk (Row1/Row2) Type of Study Value 95% Confidence Limits -------------------------------------------------------------------- Case-Control 1.7333 1.0097 2.9756 Loosely speaking: There is a 73% increase chance of asthma if you are low SES (versus high SES).