Download
1 / 62
620 likes | 626 Views
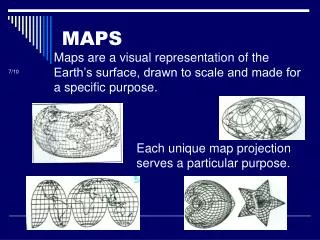
MAPS. Why do we use maps?. To show DISTANCES To show LAND FORMS (mountains, lakes, rivers, etc ) To show MAN MADE STRUCTURES (cities, roads, mines) the study and making of maps is called CARTOGRAPHY. MAKING MAPS: Map Projections. Maps are tricky: Earth is round but paper is flat.

E N D
Why do we use maps? • To show DISTANCES • To show LAND FORMS (mountains, lakes, rivers, etc) • To show MAN MADE STRUCTURES (cities, roads, mines) • the study and making of maps is called CARTOGRAPHY.
MAKING MAPS: Map Projections • Maps are tricky: Earth is round but paper is flat. • Mapmakers use three different map projections: • Mercator • Gnomonic • Polyconic
Mercator Projection • Shows the WHOLE WORLD (except extreme polar regions) on one continuous map • Shows true direction as STRAIGHT LINES • BUT high latitudes are ENLARGED
Gnomonic Projection • As if a SHEET OF PAPER was laid on a point on Earth’s surface • Correctly shows SHORTEST ROUTE between two points • BUT DIRECTION and DISTANCE are distorted
Polyconic Projection • Projects points and lines from a globe onto a CONE. • Cone touches the globe at a particular line of latitude along which there is very little distortion in the AREAS or SHAPES. • More ACCURATE • Best for making TOPOGRAPHIC maps
Latitude: Distance North and South • Measured by PARALLELS – (horizontal lines running East to West) • Distance measured in DEGREES north and south of the equator. • Latitude of Equator is 0 degrees. • Poles are at 90 degrees • Degrees are divided into minutes and seconds
Latitude • Because lines are parallel (never meet), distance between the lines never change. • 1° = 112km • 1° = 60 min • 1 min = 1/60 degree • Distance from equator to pole is 40,000km
LONGITUDE: DISTANCE EAST AND WEST • Measured in MERIDIANS • Measured in degrees • PRIME MERIDIAN is the starting line for the world-wide longitude system, at Greenwich, England. • The furthest you can get is 180 degrees either East or West. • Degrees divided into minutes and seconds.
LONGITUDE: DISTANCE EAST AND WEST • No set km, because linesconverge at poles. • Example: a city at 30° East near the equator would be farther away from prime meridian than a city at 30° East closer to the pole.
Latitude and Longitude • Both are divided into minutes and seconds. • Example Burnaby is located at: • 49° 16' 2" N • 122° 58' 8" W
Antipode – direct opposite of something else • Opposite point on Earth from a location • Antipode calculator: https://www.antipodesmap.com/
GREAT CIRCLES • Great Circle is any circle whose plane passes through the CENTER of the sphere. • All other circles are small circles. • Great Circles show the SHORTEST route between two points. • Used in AIRPLANE TRAVEL
PRACTICE READING LATITUDE AND LONGITUDE • MAP ACTIVITY text book page 124 • Use maps p 664 Appendix B • Follow and Answer Procedure 1-3 • Answer Analysis and Conclusion Questions #1-6
MAP SCALES • Map scale is the RATIO of distance on the map to distance on Earth. • VERBALLY: 1 centimeter = 1 kilometer • GRAPHICALLY: • NUMERICALLY: 1:100,000
PRACTICE USING MAP SCALES • WORKSHEET
Topographical Map • A type of map indicating elevation in relief (highs and lows, like hills and valleys), using contour lines
Contour Lines • Contour lines show ELEVATION, STEEPNESS, SHAPE of land
Topographical Map • Shows natural features (mountains, valleys, plains, lakes, rivers • And man-made features (roads, boundaries, radio towers, and major buildings)
Uses of Topographical Maps • Used by ENGINEERS as they look for coal, oil, and gas. • Used to plan RESIDENTIAL and COMMERCIAL developments. • Used by the MILITARY and for RECREATIONAL purposes like hiking and camping.
Contour Lines • CONTOUR INTERVAL: distance in elevation between two consecutive contour lines. • INDEX CONTOURS: Every 5th line is bolder, elevation marked.
Rules for Contours • Contour lines NEVER CROSS • Contours form CLOSEDLOOPS (even if not shown of the map).
Rules for Contour Lines • Contours BEND UPSTREAM (uphill) when crossing a stream
Rules for Contours The highest possible elevation of the hill is just below the value of the next line that is not shown 90 80 70 60 50
Rules for Contours The lowest possible elevation of a depression is just above the value of the next line that is not shown 90 90 51 80 70 60 50
Gradient (slope or steepness) • Difference in elevation between two points divided by the distance between the two points. • https://www.youtube.com/watch?v=3QFJ_uv2mGw
Gradient • Elevation of Y is 300m. • By looking at the high point of 400m, we deduce the interval is 20m • Elevation of X is 380m
Gradient • To find the distance between X and Y, line up a piece of paper. • Then line it up to the scale on the map (not shown). • Let’s assume distance is 1.5 km.
Gradient So gradient would be: = (380m - 300m) 1.5 km = 53.3 m elevation gain for every km travelled.
Depression Contours • HACHURES – short lines at right angles to the contour line that point DOWNWARD toward the lower elevation • Used to represent features that are LOWER than the surrounding area • The elevation of the first depression contour is the same as the lowest regular contour near it.
Benchmarks • a location whose exact elevation KNOWN and is noted on a brass or aluminum plate. • bench marks are shown on maps by an “X” with the letters BM written next to them.
Map Legend • Features are represented by SYMBOLS • Legend explains what the symbols mean
Notice the two high points on the island. • What is the elevation of the two high points?
What is the elevation of Point A? • Point A sits right on the 0 ft contour line. Since all points on this line have an elevation of 0 ft, the elevation of point A is zero.
What is the elevation of Point B? • Point B sits right on the 10 ft contour line. Since all points on this line have an elevation of 10 ft, the elevation of point B is 10 ft.
What is the elevation of Point C? • Point C does not sit directly on a contour line so we can not determine the elevation precisely. • greater than 10 ft and less than 20 ft. • Because point C is midway between these contour lines we can estimate the elevation is about 15 feet (assuming slope is constant between the two contour lines).
What is the elevation of Point D? • Point D is inside the 20 ft. (so above 20 ft but less than 30 ft) because there is no 30 ft. contour line shown. • Could be 21 ft, or it could be 29 ft. • No way to tell from the map.
What is the elevation of Point E? • need to estimate somewhere between the 0-10ft. • closer to the 10 ft line than the 0 ft, • 8 ft. seems reasonable. • assuming constant slope
Approximately how tall is Able Hill? • Approximately how tall is Baker Hill? • Which mountain is taller, and by about how much? • How many meters of elevation are there between contour lines on the topographic map? • Which mountain has steeper slopes? • Are the contour lines closer together on Able Hill or Baker Hill?
Check your Understanding 1. What are contour maps used for? • What information is found on a contour map? • How can you determine how steep a gradient is?
Mapping Assignment • Create your own map