Download
1 / 31
310 likes | 478 Views
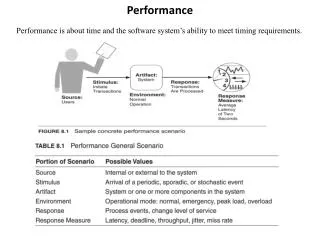
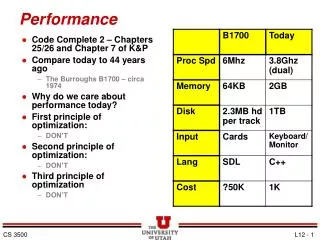
Performance. What Is Performance?. Fast!? “Performance” is meaningless in isolation It only makes sense to talk about performance of a particular workload, and according to a particular set of metrics Queries per second in Web server Response latency in DNS server

E N D
What Is Performance? • Fast!? • “Performance” is meaningless in isolation • It only makes sense to talk about performance of a particular workload, and according to a particular set of metrics • Queries per second in Web server • Response latency in DNS server • Number of delivery per second in Mail server
Factors That Affect Performance • Four major resources • CPU • Memory • Hard disk I/O bandwidth • Network I/O bandwidth • Where is the real bottleneck • Not CPU, hard disk bandwidth it is !! • Memory size has a major influence on performance • When memory is not enough, system will do swap, so memory and disk bandwidth are the major suspects
What is your system doing? • CPU use • Disk I/O • Network I/O • Application (mis-)configuration • Hardware limitations • System calls and interaction with the kernel • Multithreaded lock contention • Typically one or more of these elements will be the limiting factor in performance of your workload • Monitoring interval should not be too small
Analyzing CPU usage – (1) • Three information of CPU • Load average • Overall utilization • Help to identify whether the CPU resource is the system bottleneck • Per-process consumption • Identify specific process’s CPU utilization
Analyzing CPU usage – (2) • Load average • The average number of runnable processes • Including processes waiting for disk or network I/O • uptime(1) • Show how long system has been running and the load average of the system over the last 1, 5, and 15 minutes $ uptime 2:34PM up 500 days, 57 mins, 1 user, load averages: 0.05, 0.14, 0.16
Analyzing CPU usage – (3) • vmstat(8) – Overall utilization • procs • r(in running queue)、b(block for resources)、w(runnable) • cpu • us(user time): high computation • sy(system time): processes make lots of system call or perform I/O • id: cpu idle • faults (average per second over last 5 seconds) • in: device interrupt per interval • sy: system calls per interval • cs: cpu context switch rate $ vmstat -c 2 -w 5 procs memory page disks faults cpu r b w avm fre flt re pi po fr sr ad6 ad10 in sy cs us sy id 0 0 5 4091M 5491M 88 0 0 0 206 54 0 0 114 243 182 5 0 95 0 0 5 4091M 5491M 1 0 0 0 0 0 0 0 46 311 605 0 0 100
Analyzing CPU usage – (4) • Examples • Idle server • Busy server $ vmstat -c2 -w5 procs memory page disks faults cpu r b w avm fre flt re pi po fr sr ad0 ad1 in sy cs us sy id 0 0 0 2538M 1066M 402 0 0 0 420 0 0 0 13 130 408 0 0 99 0 0 0 2538M 1066M 1 0 0 0 49 0 13 13 31 48 546 0 0 100 $ vmstat -c5 -w5 procs memory page disks faults cpu r b w avmfreflt re pi pofrsr ad4 da0 in sycs us sy id 2 0 1 690M 232M 126 0 0 0 94 408 0 0 351 402 376 3 3 94 0 0 1 690M 199M 1 0 0 0 11871 5080 1 525 3230 62995 23430 15 33 52 0 0 1 690M 114M 0 0 0 0 7189 5057 1 422 3220 65025 23457 15 29 56 1 0 1 710M 203M 2462 0 0 0 10242 13482 9 508 3003 58952 28737 30 31 39 0 0 1 698M 177M 47 0 0 0 13409 5239 22 606 2976 57848 22524 16 34 50
Analyzing CPU usage – (5) • Per-process consumption • top command • Display and update information about the top cpu processes • ps command • Show process status
Analyzing CPU usage – (6) • top(1) – Show a realtime overview of what CPU do • Paging to/from swap • Performance kiss of death • Spending lots of time in the kernel, or processing interrupts • Which processes/threads are using CPU • What they are doing inside the kernel • Eg. Biord/biowr/wdrain: disk I/O • sbwait: waiting for socket input • ucond/umtx: waiting on an application thread lock • Many more • Only documented in the source code • Context switchs • Voluntary: process blocks waiting for a resource • Involuntary: kernel decides the process should stop running for now
Analyzing CPU usage – (7) last pid: 68356; load averages: 0.15, 0.11, 0.12 up 42+03:58:29 14:48:49 75 processes: 2 running, 73 sleeping CPU: 5.5% user, 0.0% nice, 0.2% system, 0.2% interrupt, 94.1% idle Mem: 435M Active, 852M Inact, 549M Wired, 18M Cache, 210M Buf, 126M Free Swap: 2048M Total, 45M Used, 2003M Free, 2% Inuse PID USERNAME THR PRI NICE SIZE RES STATEC TIME WCPU COMMAND 68108 vscan 1 59 0 153M 68652K select 0 0:11 11.67% perl 68249 vscan 1 47 0 148M 63292K select 3 0:03 2.88% perl 68127 vscan 1 20 0 152M 68352K lockf 1 0:08 1.27% perl 68351 liuyh 1 44 0 8104K 2228K CPU0 2 0:00 0.49% top 837 idlst 1 44 0 23100K 5488K select 2 104:11 0.00% perl5.8.9 629 root 1 44 0 5684K 800K select 0 93:36 0.00% syslogd 29270 postgrey 1 44 0 35444K 8064K select 3 57:45 0.00% perl5.12.4 913 root 1 4 0 5808K 1096K kqread 3 43:01 0.00% master 657 root 1 44 0 6688K 1936K select 1 33:11 0.00% ypserv 926 postfix 1 4 0 8880K 3452K kqread 3 26:13 0.00% qmgr 29129 clamav 1 20 0 28708K 3352K pause 1 8:52 0.00% freshclam 29845 vscan 1 44 0 144M 24012K select 0 3:34 0.00% perl 17889 postfix 1 4 0 7000K 2572K kqread 1 3:32 0.00% anvil 35953 liuyh 1 4 0 4600K 796K kqread 2 3:26 0.00% tail 688 root 1 44 0 9724K 8772K select 0 2:33 0.00% amd 766 root 1 44 0 10428K 1512K select 2 1:48 0.00% ntpd -H: threads -S: kernel -a: process titles
Analyzing CPU usage – (8) last pid: 68553; load averages: 0.39, 0.23, 0.14 up 42+04:08:33 14:58:53 74 processes: 1 running, 73 sleeping CPU: 4.9% user, 0.0% nice, 0.5% system, 0.1% interrupt, 94.6% idle Mem: 417M Active, 851M Inact, 553M Wired, 18M Cache, 210M Buf, 142M Free Swap: 2048M Total, 45M Used, 2003M Free, 2% Inuse PID USERNAME VCSWIVCSW READ WRITE FAULT TOTAL PERCENT COMMAND 68521 vscan 22 5 0 0 0 0 0.00% perl 68249 vscan 0 0 0 0 0 0 0.00% perl 68304 vscan 1 0 0 0 0 0 0.00% perl 68522 vscan 0 0 0 0 0 0 0.00% perl 68520 vscan 0 0 0 0 0 0 0.00% perl 837 idlst 2 0 0 0 0 0 0.00% perl5.8.9 629 root 21 0 0 0 0 0 0.00% syslogd 29270 postgrey 3 0 0 2 0 2 33.33% perl5.12.4 913 root 59 0 0 0 0 0 0.00% master 657 root 29 21 0 0 0 0 0.00% ypserv 926 postfix 2 2 0 0 0 0 0.00% qmgr 29129 clamav 0 0 0 0 0 0 0.00% freshclam 29845 vscan 0 0 0 0 0 0 0.00% perl 17889 postfix 7 2 0 0 0 0 0.00% anvil 35953 liuyh 2 0 0 0 0 0 0.00% tail 688 root 2 0 0 0 0 0 0.00% amd 766 root 2 0 0 0 0 0 0.00% ntpd -m: switch cpu/io mode
Analyzing memory usage –(1) • When memory is not enough … • Memory page has to be “swapped out” to the disk block • LRU (Least Recently Used) algorithm • Bad situation – “desperation swapping” • Kernel forcibly swaps out runnable process • Extreme memory shortage • Two numbers that quantify memory activity • Total amount of active virtual memory • Tell you the total demand for memory • Page rate • suggest the proportion of actively used memory
Analyzing memory usage – (2) • To see amount of swap space in use • pstat -s / swapinfo (FreeBSD) • pstat(8): • % pstat -s $ pstat -s Device 1K-blocks Used Avail Capacity /dev/label/swap-0 1048572 272996 775576 26% /dev/label/swap-1 1048572 269812 778760 26% Total 2097144 542808 1554336 26%
Analyzing memory usage – (3) • vmstat • memory • avm: active virtual pages • fre: size of the free list • page (averaged each five seconds, given in units per second) • flt: total number of page faults • re: page reclaims • pi: pages paged in • po: pages paged out • 50 page-out cause about 1 seconds latency • fr: pages freed per second • sr: pages scanned by clock algorithm, per-second $ vmstat -c 2 -w 5 procs memory page disks faults cpu r b w avm fre flt re pi po fr sr ad6 ad10 in sy cs us sy id 0 0 5 4091M 5491M 88 0 0 0 206 54 0 0 114 243 182 5 0 95 0 0 5 4091M 5491M 1 0 0 0 0 0 0 0 46 311 605 0 0 100
Analyzing memory usage – (4) last pid: 68356; load averages: 0.15, 0.11, 0.12 up 42+03:58:29 14:48:49 75 processes: 2 running, 73 sleeping CPU: 5.5% user, 0.0% nice, 0.2% system, 0.2% interrupt, 94.1% idle Mem: 435M Active, 852M Inact, 549M Wired, 18M Cache, 210M Buf, 126M Free Swap: 2048M Total, 45M Used, 2003M Free, 2% Inuse PID USERNAME THR PRI NICE SIZERES STATE C TIME WCPU COMMAND 68108 vscan 1 59 0 153M 68652K select 0 0:11 11.67% perl 68249 vscan 1 47 0 148M 63292K select 3 0:03 2.88% perl 68127 vscan 1 20 0 152M 68352K lockf 1 0:08 1.27% perl 68351 liuyh 1 44 0 8104K 2228K CPU0 2 0:00 0.49% top 837 idlst 1 44 0 23100K 5488K select 2 104:11 0.00% perl5.8.9 629 root 1 44 0 5684K 800K select 0 93:36 0.00% syslogd 29270 postgrey 1 44 0 35444K 8064K select 3 57:45 0.00% perl5.12.4 913 root 1 4 0 5808K 1096K kqread 3 43:01 0.00% master 657 root 1 44 0 6688K 1936K select 1 33:11 0.00% ypserv 926 postfix 1 4 0 8880K 3452K kqread 3 26:13 0.00% qmgr 29129 clamav 1 20 0 28708K 3352K pause 1 8:52 0.00% freshclam 29845 vscan 1 44 0 144M 24012K select 0 3:34 0.00% perl 17889 postfix 1 4 0 7000K 2572K kqread 1 3:32 0.00% anvil 35953 liuyh 1 4 0 4600K 796K kqread 2 3:26 0.00% tail 688 root 1 44 0 9724K 8772K select 0 2:33 0.00% amd 766 root 1 44 0 10428K 1512K select 2 1:48 0.00% ntpd
Analyzing disk I/O – (1) • For disk-intensive workloads • Limited by bandwidth or latency(response time for an I/O operation) • Random access reads/writes requires the disk to constantly seek • Limiting throughput • Sequential I/O is limited by the transfer rate of the disk and controller
Analyzing disk I/O – (2) • iostat(8) • Report I/O statistics • tin/tout: characters read from /write to terminal • KB/t: kilobytes per transfer • tps: transfers per second • MB/s: megabytes per second • cpu • ni: % of cpu time in user mode running niced processes • in: % of cpu time in interrupt mode $ iostat–c5 -w5 tty da0 da1 cpu tin tout KB/t tps MB/s KB/t tps MB/s us nisy in id 0 26 20.59 15 0.30 20.60 15 0.30 5 0 1 0 94 0 36 6.17 1 0.01 6.17 1 0.01 0 0 0 0 100 0 12 33.95 52 1.73 33.95 52 1.73 7 0 1 0 91 0 12 10.46 5 0.05 10.46 5 0.05 4 0 1 0 96 0 12 15.38 8 0.12 15.38 8 0.12 1 0 0 0 99
Analyzing disk I/O – (3) • gstat(8) • High latency is the most obvious sign of an overloaded disk dT: 0.017s w: 1.000s L(q) ops/sr/skBpsms/rw/skBpsms/w%busy Name 0 0 0 0 0.0 0 0 0.0 0.0| acd0 0 172 172 1607 3.2 0 0 0.0 55.9| da0 0 230 230 1836 3.9 0 0 0.0 88.9| da1 0 172 172 1607 3.3 0 0 0.0 56.1| da0s1 0 230 230 1836 3.9 0 0 0.0 89.1| da1s1 0 172 172 1607 3.3 0 0 0.0 56.3| da0s1a 0 0 0 0 0.0 0 0 0.0 0.0| da0s1b 0 0 0 0 0.0 0 0 0.0 0.0| da0s1c 0 0 0 0 0.0 0 0 0.0 0.0| da0s1d 0 230 230 1836 3.9 0 0 0.0 89.3| da1s1a 0 0 0 0 0.0 0 0 0.0 0.0| da1s1b 0 0 0 0 0.0 0 0 0.0 0.0| da1s1c 0 0 0 0 0.0 0 0 0.0 0.0| da1s1d 0 230 230 3443 3.9 0 0 0.0 89.8| mirror/gm0s1a
Analyzing disk I/O – (4) last pid: 68553; load averages: 0.39, 0.23, 0.14 up 42+04:08:33 14:58:53 74 processes: 1 running, 73 sleeping CPU: 4.9% user, 0.0% nice, 0.5% system, 0.1% interrupt, 94.6% idle Mem: 417M Active, 851M Inact, 553M Wired, 18M Cache, 210M Buf, 142M Free Swap: 2048M Total, 45M Used, 2003M Free, 2% Inuse PID USERNAME VCSW IVCSW READ WRITE FAULT TOTAL PERCENT COMMAND 68521 vscan 22 5 0 0 0 0 0.00% perl 68249 vscan 0 0 0 0 0 0 0.00% perl 68304 vscan 1 0 0 0 0 0 0.00% perl 68522 vscan 0 0 0 0 0 0 0.00% perl 68520 vscan 0 0 0 0 0 0 0.00% perl 837 idlst 2 0 0 0 0 0 0.00% perl5.8.9 629 root 21 0 0 0 0 0 0.00% syslogd 29270 postgrey 3 0 0 2 0 2 33.33% perl5.12.4 913 root 59 0 0 0 0 0 0.00% master 657 root 29 21 0 0 0 0 0.00% ypserv 926 postfix 2 2 0 0 0 0 0.00% qmgr 29129 clamav 0 0 0 0 0 0 0.00% freshclam 29845 vscan 0 0 0 0 0 0 0.00% perl 17889 postfix 7 2 0 0 0 0 0.00% anvil 35953 liuyh 2 0 0 0 0 0 0.00% tail 688 root 2 0 0 0 0 0 0.00% amd 766 root 2 0 0 0 0 0 0.00% ntpd Not currently supported by ZFS
Tuning disk performance – (1) • Reduce disk contention • Move competing I/O jobs onto independent disks • Stripe multiple disks with gstripe • For filesystems striped across multiple disks • Make sure the filesystem boundary is stripe-aligned • Eg. For 64k stripe sizes, start of filesystem should be 64k-aligned to avoid splitting I/O between multiple stripes • Add more/better hardware
Tuning disk performance – (2) • Try to restructure the workload to separate “critical” data and “scratch” data • Scratch data can be reconstructed or discarded after a crash • Can afford to use fast but less reliable storage options • mount –o async is fast but unsafe • Go one step further: store temporary data in memory • mdconfig –a –t swap –s 4g; mount –o async ... • Creates a “swap-backed” memory device • Swap only used when memory is low, otherwise stored in RAM
Analyzing network – (1) • netstat(1) – show network status • Also list listening sockets • netstat –a • Show the state of all interfaces • netstat –i • Examining the routing table • netstat –rn $ netstat -i Name Mtu Network Address IpktsIerrsOpktsOerrsColl bge0 1500 <Link#1> 00:14:5e:0a:04:46 243305175 0 258986572 0 0 bge0 1500 140.113.235.0 csmx1 226106854 - 258954715 - - bge1* 1500 <Link#2> 00:14:5e:0a:04:47 0 0 0 0 0 lo0 16384 <Link#3> 90390695 0 90390905 0 0 lo0 16384 your-net localhost 90390847 - 90390833 - - $ netstat -rn Routing tables Internet: Destination Gateway Flags Refs Use Netif Expire default 140.113.235.254 UGS 0 120166226 bge0 127.0.0.1 127.0.0.1 UH 0 90395361 lo0 140.113.235.0/24 link#1 UC 0 0 bge0
Analyzing network – (2) • netstat(1) • Show network traffic • netstat -w 3 • Display system‐wide statistics for each network protocol • netstat –s $ netstat -w 3 input (Total) output packets errs bytes packets errs bytes colls 310 0 66791 364 0 87302 0 123 0 13148 116 0 12739 0 108 0 17164 133 0 26152 0
Analyzing network – (3) • sockstat(1) – list open sockets USER COMMAND PID FD PROTO LOCAL ADDRESS FOREIGN ADDRESS postfix smtp 71167 6 stream private/smtp postfix smtp 71167 7 dgram -> /var/run/logpriv postfix smtp 71167 10 udp4 *:680 *:* vscanperl 71118 4 tcp4 127.0.0.1:10024 *:* vscanperl 71118 8 udp4 *:49868 *:* vscanperl 71118 9 tcp4 127.0.0.1:10024 127.0.0.1:50823 vscanperl 71118 11 udp4 140.113.235.104:8349 140.113.235.107:53 postfix smtpd 70979 6 tcp4 *:25 *:* postfix smtpd 70979 7 dgram -> /var/run/logpriv postfix smtpd 70979 14 udp4 *:60158 *:* root master 913 12 tcp4 *:25 *:* root master 913 19 stream public/cleanup root master 913 25 stream private/tlsmgr root master 913 28 stream private/rewrite root sshd 963 3 tcp4 *:22 *:*
Tuning network performance • Check packet loss and protocol negotiation • Socket buffer too small? • kern.ipc.maxsockbuf – maximum socket buffer size • setsockopt(…, SO_{RCV, SND}BUF, …) • net.inet.udp.recvspace • UDP will drop packets if the receive buffer fills • TCP largely self-tuning • Check for hardware problems
Display system statistics • systat(1) • systat –display refresh-interval 1 users Load 0.34 0.21 0.17 Dec 20 17:34 Mem:KB REAL VIRTUAL VN PAGER SWAP PAGER Tot Share Tot Share Free in out in out Act 426804 41184 1652240 79656 230028 count All 533316 74948 1075644k 272216 pages Proc: Interrupts r p d s w Csw Trp Sys Int Sof Flt 101 cow 8655 total 1 76 4089 2645 8949 651 465 2581 503 zfod 138 mpt0 irq28 ozfod atkbd0 1 2.0%Sys 0.3%Intr 11.9%User 0.0%Nice 85.8%Idle %ozfod ata0 irq14 | | | | | | | | | | | daefr 513 bge0 bge1 =>>>>>> 167 prcfr 2001 cpu0: time 390 dtbuf 1055 totfr 2001 cpu1: time Namei Name-cache Dir-cache 100000 desvn react 2001 cpu2: time Calls hits % hits % 87830 numvn pdwak 2001 cpu3: time 4929 4313 88 2 0 25000 frevn pdpgs intrn Disks da0 da1 446440 wire KB/t 54.71 54.71 429112 act tps 73 73 922628 inact MB/s 3.90 3.90 58268 cache %busy 13 13 171760 free 99888 buf
When to throw hardware at the problem • Only once you have determined that a particular hardware resource is your limiting factor • More CPU cores will not solve a slow disk • Adding RAM can reduce the need for some disk I/O • More cached data, less paging from disk • Adding more CPU cores is not a magic bullet for CPU limited jobs • Some applications do not scale well • High CPU can be caused by resource contention • Recourse contention will make performance worse!!!
*stat commands $ ls-la {,/usr}{/bin,/sbin}/*stat -r-xr-xr-x 1 root wheel 52056 Sep 1 18:06 /sbin/ipfstat* -r-xr-xr-x 1 root wheel 7688 Sep 1 18:06 /sbin/kldstat* -r-xr-sr-x 1 root kmem 12312 Sep 1 18:06 /usr/bin/btsockstat* -r-xr-sr-x 1 root kmem 21472 Sep 1 18:06 /usr/bin/fstat* -r-xr-xr-x 1 root wheel 20848 Sep 1 18:06 /usr/bin/ministat* -r-xr-sr-x 1 root kmem 156128 Sep 1 18:06 /usr/bin/netstat* -r-xr-xr-x 1 root wheel 16632 Sep 1 18:06 /usr/bin/nfsstat* -r-xr-xr-x 1 root wheel 20616 Sep 1 18:06 /usr/bin/procstat* -r-xr-xr-x 1 root wheel 15664 Sep 1 18:06 /usr/bin/sockstat* -r-xr-xr-x 2 root wheel 16920 Sep 1 18:06 /usr/bin/stat* -r-xr-xr-x 1 root wheel 85848 Sep 1 18:06 /usr/bin/systat* -r-xr-xr-x 1 root wheel 27400 Sep 1 18:06 /usr/bin/vmstat* -r-xr-xr-x 1 root wheel 19880 Sep 1 18:06 /usr/sbin/gstat* lrwxr-xr-x 1 root wheel 21 Sep 1 18:06 /usr/sbin/hoststat@ -r-xr-xr-x 1 root wheel 17432 Sep 1 18:06 /usr/sbin/ifmcstat* -r-xr-xr-x 1 root wheel 19896 Sep 1 18:06 /usr/sbin/iostat* -r-xr-xr-x 1 root wheel 46152 Sep 1 18:05 /usr/sbin/lockstat* -r-xr-xr-x 1 root wheel 73448 Sep 1 18:07 /usr/sbin/pmcstat* -r-xr-xr-x 2 root wheel 13768 Sep 1 18:07 /usr/sbin/pstat* lrwxr-xr-x 1 root wheel 21 Sep 1 18:06 /usr/sbin/purgestat@
Further Reading • Help! My system is slow! • http://people.freebsd.org/~kris/scaling/Help_my_system_is_slow.pdf • Further topics • Device I/O • Tracing system calls used by individual process • Activity inside the kernel • Lock profiling • Sleepqueue profiling • Hardware performance counters • Kernel turing • Benchmarking techniques • ministat(1)