Download
1 / 25
250 likes | 391 Views
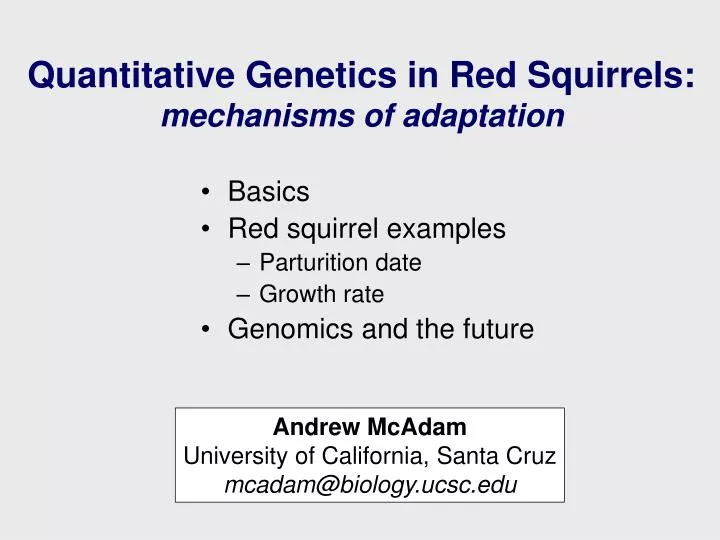
Quantitative Genetics in Red Squirrels: mechanisms of adaptation. Basics Red squirrel examples Parturition date Growth rate Genomics and the future. Andrew McAdam University of California, Santa Cruz mcadam@biology.ucsc.edu. Quantitative Genetics.

E N D
Quantitative Genetics in Red Squirrels:mechanisms of adaptation • Basics • Red squirrel examples • Parturition date • Growth rate • Genomics and the future Andrew McAdam University of California, Santa Cruz mcadam@biology.ucsc.edu
Quantitative Genetics Examines the genetics of continuously varying (quantitative) traits Traditional Quantitative Genetics estimates sources of trait variation by examining the phenotypic resemblance among known relatives. Understanding the genetic basis to quantitative traits allows us to predict future evolutionary responses to selection
R = h2 S R. Rothman Schroeder J. Merilä
350 300 250 200 Spruce Cones 150 100 50 0 1988 1990 1992 1994 1996 1998 2000 Quantitative Genetics in Red Squirrels • Sources of variation • Heritability • Maternal effects • Selection • Response to selection
Parturition Date Increase in Food Abundance Increase in Temperature
Parturition Date - Heritability Matrilineal Pedigree (1989-2001) 1059 breeding events 568 females 5 generations Paternity and Maternal Effects?? h2 = 0.16 ± 0.03 - Réale et al., 2003, Evolution
4 2 Lifetime fitness residuals 0 -2 -2 -1 0 1 2 3 Parturition Date (s.d. units) Parturition Date - Selection Fitness: total number of offspring produced in lifetime. Considered females dead prior to 2000 (n=303) S = - 8.96 ± 2.56 - Réale et al., 2003, Evolution
Response to Selection (R) Predicted R = - 1.4 days/gen. Observed R = - 6.0 days/gen. R = h2 S (1991-2001) n = 11 years Plasticity = - 23.1 days/cone index - Réale et al., 2003, Proc. Roy. Soc. L., B
Parturition Date Questions • Does food supplementation result in the plastic advancement in breeding? • Are there differences in the heritability of parturition date between the experimental and control populations? • Does selection on parturition date differ between experimental and control populations? • Do these differences in selection result in experimental evolution of earlier breeding?
Maternal Effects Occur when thephenotypeof a mother causes phenotypiceffects in her offspring www.sbgmath.com • Widespread • Strong in mammals • Predicted to have important effects on evolutionary dynamics…if heritable
Nestling Growth Rate(g/day) Cross-Foster ~25 Days
Percentage of variation in growth in body mass 10% Genetic Maternal 9% G x E Error 81% h2 = 0.09± 0.04
Maternal Growth Rate h2 = 0.09 Maternal Effects Litter Size Parturition Date Offspring Growth Rate
Maternal Growth Rate h2 = 0.09 + + Maternal Effects Offspring Growth Rate h2t = 0.31 - McAdam et al., 2002, Evolution
2.1 2.0 1.9 1.8 1.7 1.6 1.5 Food Effects on Growth 1989 - 2001 Growth rate (g/day) n = 32 n = 176 n = 72 n = 13 years 1999 2000 Food Cross-fostered Slope = 0.23 g/day/log conest-1
h2t = 0.52* (h2 = 0.10)* cov(dir,mat) 1999 0.043 2000 0.079 Food - 0.005 0.25 0.20 h2t = 0.70 (h2 = 0.12) 0.15 Coefficient of Variation 0.10 h2t = 0.57 (h2 = 0.57) 0.05 0.00 Direct Genetic Maternal 1999 2000 Food - McAdam & Boutin, 2003, J. Evol. Biol.
1.6 * * 1.2 0.8 * * Linear selection gradients (β') 0.4 0.0 * - 0.4 All years 1990 1992 1994 1996 1998 2000 Viability Selection on Growth Fitness: survival to potential breeding age Other variables in model: Litter size, parturition date, sex, year No spatial variation in selection - McAdam & Boutin 2003, Evolution
Components of Selection Birth Spring temperature (-) Emergence Recruitment Previous year’s cones (+) Breeding
Maternal Effects h2 Selection Corrected Growth (t) Corrected Growth (t+1) Response
0.5 0.4 0.3 0.2 0.1 0.0 -0.1 -0.2 -0.3 Maternal Effects and the Response to Selection * • Observed response greater than predicted by h2 • Response not independent of selection in the previous generation Response (g/day) * * 1989 1991 1993 1995 1997 1999 Year - McAdam & Boutin 2003, Proc. Roy. Soc. L., B
Growth Rate Questions • Does food supplementation increase nestling growth rates? • Does food supplementation eliminate maternal effects? • Does selection on growth rates differ between experimental and control populations? • Do these differences in selection result in experimental evolution of earlier breeding? • Do maternal effects contribute to evolution in the control population but not the food supplemented one?
Genetic Mechanisms of Adaptation Quantitative Trait Loci (QTL’s) It has recently become possible to use genetic markers to determine regions of the genome (loci?) that contribute to quantitative variation. QTL’s can be mapped for natural populations with extensive pedigrees and many molecular markers
Genetics of Speciation in Sticklebacks - Peichel et al., 2001, Nature
Ecological and Evolutionary Functional Genomics (EEFG) Development Q. Genetics Genomics Selection Genes Genotype Phenotype Phenotype’ Evolution
Genes Genotype Phenotype Phenotype’ Evolution