Download
1 / 19
190 likes | 351 Views
Weather Analysis: Contouring AOS 101 – Section 302 Ross Lazear February 6, 2007. Last week, we learned…. - Station models are an efficient and concise way to represent weather conditions at multiple locations How to plot and analyze these station models.

E N D
Weather Analysis: Contouring AOS 101 – Section 302 Ross Lazear February 6, 2007
Last week, we learned… • - Station models are an efficient and concise way to represent weather conditions at multiple locations • How to plot and analyze these station models - In the station model from MSN on Feb. 4 at 20:29 UTC, to the right: Temp: -5 F Dewpoint: -22 F Sea Level Pressure: 1022.6 hPa (mb) Wind: 15 knots from the WNW Sky: Missing, or obscured
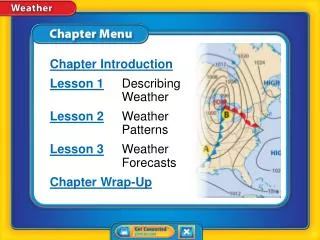
Last week, we learned… Station models do a good job of telling us what the weather conditions are like over a large area… …but at first glance, what are the lowest and highest temperatures on this map? http://ral.ucar.edu/weather
Contouring “Contoured” maps of certain variables (like this, of temperatures at 850 mb) help to graphically show locations of strong fronts, low/high pressure systems, etc. http://www.aos.wisc.edu
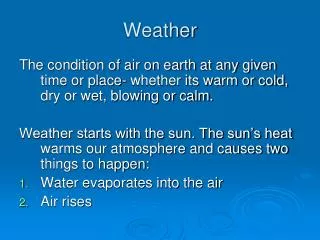
How to think about contouring: Think of contouring as a topographic map, where the lines represent places of constant height above sea level. If you were to walk along one of these lines, you would ALWAYS be at the same height above sea level.
What else can be contoured? Isopleth: a line on a map connecting points at which a given variable has a specified constant value Isobar: A line of constant pressure Isotherm: A line of constant temperature Isodrosotherm: A line of constant dewpoint Isotach: A line of constant wind speed Isohyet: A line of constant precipitation accumulation Isoneph: A line of constant cloudiness Isohaline: A line of constant salinity (saltiness in the ocean) Isoheight: A line of constant height
Isobar: Line of constant pressure http://www.spc.noaa.gov
The winds are generally almost parallel to the isobars. We call this “geostrophy.” http://www.spc.noaa.gov
Isotach: Line of constant wind speed http://www.aos.wisc.edu
Isotherm: Line of constant temperature http://ral.ucar.edu/weather
Isohyet: Line of constant precipitation accumulation http://www.crh.noaa.gov/mkx/document/snow/images/snow_12-11-00-rgn.gif
Isodrosotherm: Line of constant dewpoint http://www.rap.ucar.edu/weather/model/eta00hr_sfc_dewp.gif
Rules and Tips for Contouring • Contours will never cross each other • Contours never branch or fork, they are always onecontinuous line • Do not create contours where there is no data (i.e., over the oceans) • Always label your contours • Contour at evenly spaced increments (for surface temperature, we’ll do every 5 degrees Fahrenheit, and for sea level pressure, every 4 millibars)
Rules and Tips for Contouring • Use a pencil! You will be erasing… • Locate regions of high and low values first • Initially, sketch out how you will be making your first few contours • Make your lines as smooth as possible. • Ignore outliers, data that doesn’t seem like it fits with the “big picture.” • If you need more help, try: • http://cimss.ssec.wisc.edu/wxwise/contour/contour1.html
Examples Say these observations are temperatures. Where should we draw the 15o F isotherm??
Examples Say these observations are temperatures. Where should we draw the 15o F isotherm??
Examples Say these observations are temperatures. Where should we draw the 75o F and 80o F isotherms??
Examples Say these observations are temperatures. Where should we draw the 75o F and 80o F isotherms??