Download

1 / 19
220 likes | 418 Views
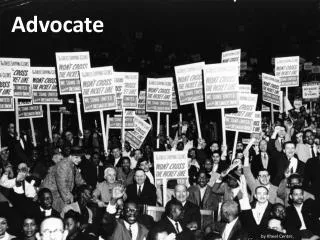
The Parent as Advocate. Peter W. D. Wright, Esq. Pamela Darr Wright, MA, MSW http://www.wrightslaw.com. Overview. Know Child: Organize File Understand Test Scores & the Bell Curve Learn How to Write IEPs Prove Your Case: Use “Letters to the Stranger;” Other Documents

E N D
The Parent as Advocate Peter W. D. Wright, Esq. Pamela Darr Wright, MA, MSW http://www.wrightslaw.com
Overview • Know Child: Organize File • Understand Test Scores & the Bell Curve • Learn How to Write IEPs • Prove Your Case: Use “Letters to the Stranger;” Other Documents • Learn How to Deal with School System; Hone Negotiation Skills
The List of Documents Use a word processor to make a chronological list of ALL documents Date Description Comments 10/6/99 Psych. Eval Scores dropped 11/9/99 Educ. Eval No progress 1/15/00 Eligibility Change to ED 2/1/00 IEP In ED class
Use Evaluations to Measure Educational Progress • Learn: What tests & subtests measure • Learn: The Bell Curve • Learn: Standard Scores • Learn: Percentile ranks • Learn: To Chart Test Scores
The Bell Curve -2SD -1SD mean +1SD + 2SD 70 85 100 115 130 2% 16% 50% 84% 98%
The Bell Curve • Learn: What tests really measure • Learn: Composite scores, subtest scores • Learn: Standard scores (SS), percentile ranks (PR), grade equivalent (GE) scores, age equivalent (AE) scores • Learn: Measure educational progress • Learn: When does apparent gain mean loss (regression)?
How to Chart Test Scores Over Time • Find repeated educational achievement tests • Examples • Woodcock Johnson Tests • Kaufmann (KTEA) • Wide Range Achievement Tests (WRAT) • Standardized Group Batteries • Compare scores; measure change in percentile ranks
Woodcock Johnson Scores:Standard Scores 1/90 5/91 10/92 6/95 Reading 97 94 90 78 Writing 87 92 91 84 Math 115 105 97 95 Mean 100 100 100 100
Woodcock Johnson Scores: Percentile Ranks 1/90 5/91 10/92 6/95 Reading 42 34 25 7 Writing 19 30 27 16 Math 84 63 42 37 Mean 50 50 50 50
IEPs with Measurable Goals & Objectives • Example #1: Typing/Keyboarding By June 15 2001, Johnny will type a passage of text at a rate of 35 words per minute with not more than 5 errors on a 5 minute timed test. • Example #2: Decoding Skills By June 15 2001, Johnny will improve letter-word identification skills from the 10th percentile level to the 25th percentile level, as measured by the WJ letter-word subtest.
Summary • Learn about the facts and law • Organize your child’s file • Use the Bell Curve to chart test scores • Develop a theme that generates empathy and desire to help
The End Peter W. D. Wright, Esq. & Pamela Darr Wright, LCSW Site: http://www.wrightslaw.com Email: webmaster@wrightslaw.com