Download
1 / 37
370 likes | 383 Views
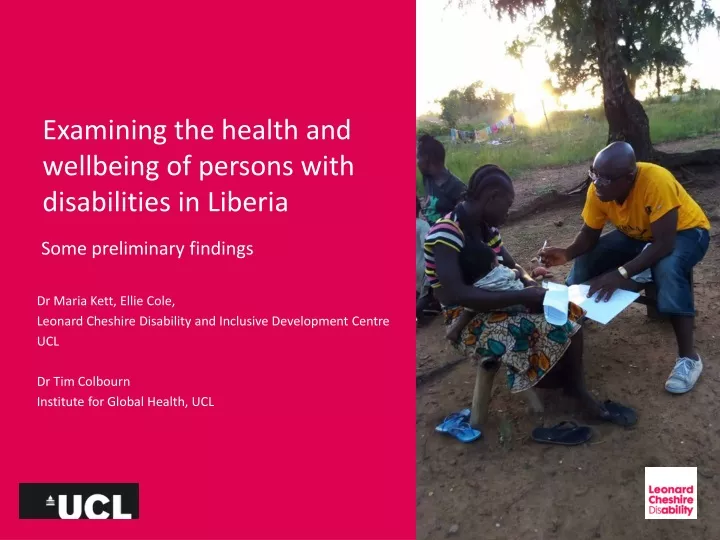
Examining the health and wellbeing of persons with disabilities in Liberia. Some preliminary findings Dr Maria Kett, Ellie Cole, Leonard Cheshire Disability and Inclusive Development Centre UCL Dr Tim Colbourn Institute for Global Health, UCL. Presentation outline.

E N D
Examining the health and wellbeing of persons with disabilities in Liberia Some preliminary findings Dr Maria Kett, Ellie Cole, Leonard Cheshire Disability and Inclusive Development Centre UCL Dr Tim Colbourn Institute for Global Health, UCL
Presentation outline • Introduction and background • Subjective and objective wellbeing • Initial analysis • Health • Participation • Impact of Ebola • Next steps
The project • DFID/ESRC Poverty Alleviation funding • Persons with disabilities and their households • Objectives • Multidimensional poverty • Subjective and objective wellbeing • Effects of poverty reduction policies
Global disability • 15% of the world’s population live with a disability • Disproportionately represented in low- and middle-income countries • Disability and multidimensional poverty • Education • Un- and underemployment • Individual and household level
Wellbeing • Move away from solely economic indicators • Objective • ‘Material’ • Externally observable and measurable • Subjective • ‘Perceived’ • Values and standards of individuals
Liberia • Civil conflict ended in 2003 • Profound effect on population and country development • 63% are under 25 • 3.0 million (70%) in multi-dimensional poverty • HDI: 177/188 (2015) • Signed UNCRPD 2007; ratified 2012 • Disability data • 2008 Census • Core Welfare Indicators Survey 2010 • Ebola outbreak (2014/2015)
National Human Rights Action Plan, 2013-2018 • Persons with disabilities specifically highlighted as a target group • Not yet ratified or implemented – lack of budgetary allocation • Range of human rights domains, including • Civil and political rights • Right to participate • Right to education • Right to employment • Right to an adequate standard of living • Right to social security • Right to health • Women’s rights • Persons with disabilities’ rights
Survey domains • Household details and asset index • Health and health services • Ebola questions • Education and literacy/numeracy • Work and employment • Transport • Social and community interactions • Crime and safety • Political engagement
Research design • Quality of life ‘snapshot’ • Quantitative wellbeing survey • Cummins - Personal Well-being Index • Washington Group short set questions • Core set of questions with additional tailored items for disabled respondents and heads of household • Qualitative research • Focus group discussions • Policy maker key informant interviews
Sampling • Non-disabled household • Disabled household Head of household Head of household Match Person with disabilities Other
Research activities • Background activities – April 2014-December 2015 • Review of ‘quality of life’ indicators • Analysis of existing national data • Review of social policies • Ebola (2014/2015) • Data collector/supervisor training – January 2016 • Data collection/entry – February-July 2016 • Data analysis – August 2016-
Some survey findings…. • Women with disabilities had the lowest literacy/numeracy rates of sample populations (86% compared to 77% non-disabled women). • Disabled women were much more likely to be completely unsatisfied with their lives (65% compared with 42% of non-disabled women) • Disabled women were more likely to have experienced crime or violence in the previous year (26% compared to 18% of non-disabled women) • Significantly more disabled women reported never feeling safe outside the home compared to non-disabled women (17% compared to 7% non-disabled women). • Strikingly, 22% of disabled women never voted, compared with 8% of non-disabled women . The main reasons given for this (apart from not being registered) were that they were not able to get to the polling station (13%) or that it is not accessible (12%).
Demographic information • Total sample = 2,020 (46.8% male; 53.2% female) • Mean age 44.1 years (s.d 16.5; range 17-97) • Mean household size 5.2 people (s.d. 2.1; range 1-16)
How would you compare your standard of living to other households in your community?
Impairments and assistive devices • 379 respondents (~70% of disabled) reported needing assistive devices – walking stick (24%); crutches (16%); glasses (15%) • 129 respondents reported needing support from others to move around • Half (49%) ‘only occasionally’ or never had access to the needed support • The main reason given was cost (70%)
Health and health services • Satisfaction with access was slightly higher in the disabled household sample (mean 2.9 vs. 2.8) but lower among disabled individuals (mean 2.5 vs. 3.0) • Majority of disabled (69.3%) and non-disabled (71.1%) households never or only occasionally had access to healthcare though • Cost was the biggest barrier to healthcare – 60.8% disabled households; 42.7% non-disabled households
Visiting health facilities • 53% of disabled households visit a government clinic (28% non-disabled households). Non-disabled household were more likely to visit government hospitals • 23% of disabled and 26% of non-disabled households would visit private clinics or hospitals
Inclusion in the community • 89.9% of disabled households were members of community groups. Predominantly religious groups (84.6% disabled households) • Participation in community activities was lower in disabled households (61.1% compared with 72.7% in non-disabled households) • Main reasons were lack of desire (30.2%), but also and the negative attitudes of community members (20.9%) • Disabled households felt less included in community decision-making
Ebola • 560 respondents reported some or many cases of Ebola in their community • Lofa - 309 • Cape Mount - 123 • Montserrado - 101 • Grand Bassa - 22 • Sinoe - 5
How did Ebola affect the community? • Non-affected communities – decreased social life was most reported (38% non-disabled and 41% disabled households • Also non-disabled households – stopped community eating (17%), closure of schools (16%), restricted movement (13%), stopped welcoming visitors (10%) • Also disabled households – stopped welcoming visitors (18%), stopped community eating (14%) and restricted movement (11%) • Affected communities – decreased social life was most reported (31% non-disabled and 80% disabled households) • Also non-disabled households – restricted movement (22%) and stopped welcoming visitors (17%)
Main problems faced during Ebola • Lack of food was the most reported problem • Affected communities – 36% non-disabled and 40% disabled households • Non-affected communities – 62% and 56% • Food scarcity is a constant problem • In affected communities, lack of information on the outbreak (12% non-disabled, 20% disabled), access to water, soap and chlorine (11%, 2%), and access to Ebola Treatment Units (11%, 5%), an closure of health facilities (6%, 10%) were also problems • In non-affected communities lack of information on the outbreak (11% non-disabled, 6% disabled) and the closure of health facilities was also a problem (12%, 8%)
‘Ebola does not discriminate’ – but do health systems? • Slightly less disabled women (41%) compared to 51% of non-disabled women said that they were a bit or completely satisfied with their access to healthcare. • 69% of women with disabilities felt that their access to health services got worse during the Ebola outbreak, compared with 60% of non-disabled women.
Information about Ebola Affected communities
Next steps • Further data analysis • Intra-household analyses • Disabled head of household analyses • ‘non-disabled’ respondents who reported functional difficulties • Clustering of disadvantages across sectors • Gender analysis • Qualitative research • More detail on interesting findings • Linking to political and institutional factors
Delete and add picture Thank you! • Questions? • m.kett@ucl.ac.uk • ellie.cole@ucl.ac.uk • t.colbourn@ucl.ac.uk