Download
1 / 7
70 likes | 76 Views
Land Use Project Overview. Primary source data: 2005 aerial imagery, 1-foot resolution Complex Systems Research Center role: Coordinate development of project standards Provide training in aerial photo interpretation Assemble regional data sets and mosaic into corridor-wide data set

E N D
Land Use Project Overview • Primary source data: 2005 aerial imagery, 1-foot resolution • Complex Systems Research Center role: • Coordinate development of project standards • Provide training in aerial photo interpretation • Assemble regional data sets and mosaic into corridor-wide data set • Produce final data set, final map, and data documentation • Provide technical support through project • Regional Planning Commissions’ role: • Actively participate in standards development • Apply standards and protocols to generate regional land cover data set • Conduct QC to verify data accuracy • Produce town-based maps from regional composite • Data will be available for download from GRANIT web site in October, 2007
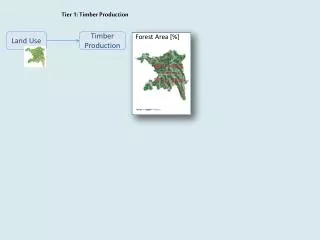
Land Use Classification 59 land use classes: 45 developed 14 agriculture/forest/wetlands/barren
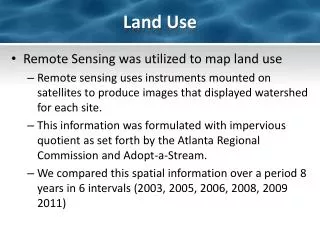
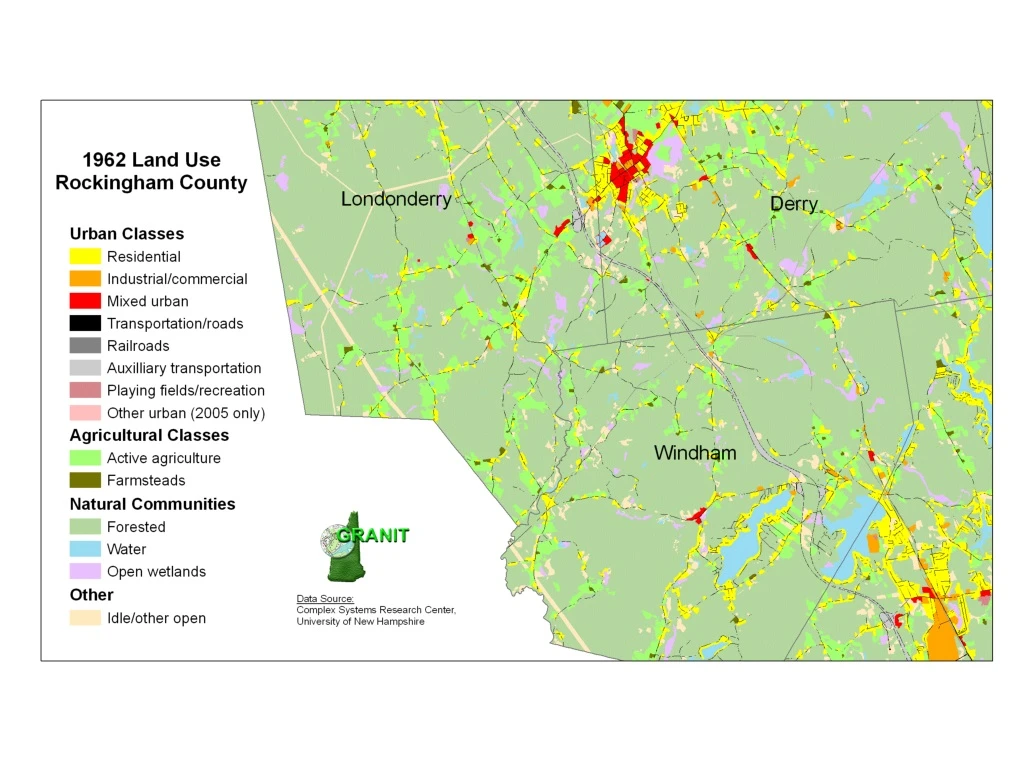
Notes for Presenter in showing 1962-2005 changes • 2005 source imagery is much more resolved, so possible to map at much more detailed level • Many I93 land use categories didn’t exist in the older data – 59 2005 classes vs. 16 older classes. • Crosswalking between old and new classes is approximate. Some categories didn’t exist, and others were redefined, e.g. previously mapped only open wetlands and now mapping all wetlands (including forested). • 2005 data is provisional as of early September, 2005.