Download
1 / 11
110 likes | 118 Views
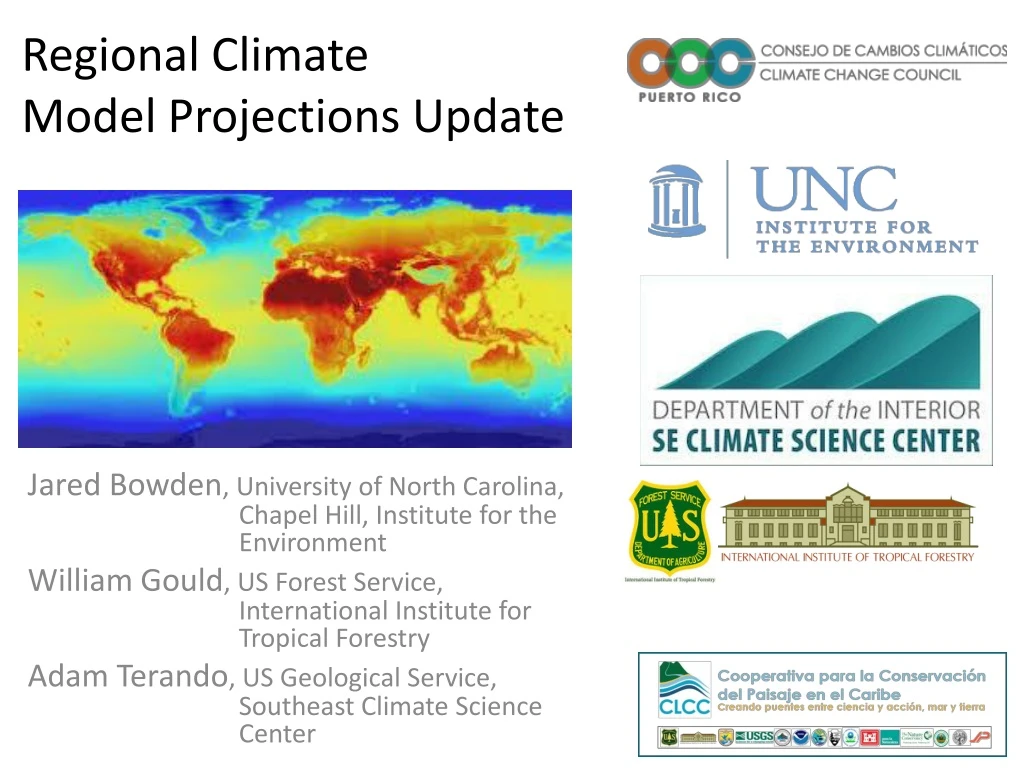
Regional Climate Model Projections Update. Jared Bowden , University of North Carolina, Chapel Hill, Institute for the Environment William Gould , US Forest Service, International Institute for Tropical Forestry Adam Terando , US Geological Service, Southeast Climate Science Center.

E N D
Regional Climate Model Projections Update Jared Bowden, University of North Carolina, Chapel Hill, Institute for the Environment William Gould, US Forest Service, International Institute for Tropical Forestry Adam Terando, US Geological Service, Southeast Climate Science Center
Existing Complementary Data Sets* • Hayhoe’s statistically downscaled data sets • Point station resolution • CMIP 3: predicts drier future • CMIP 5: aerosols added predicting wetter future • More GCMs, full century predictions • Assumes linear and constant meterological behavior from past to future time periods • PRECIS-Caribbean • 50km and 25km resolution • CMIP 3 • SE Climate Science Center dynamically downscaled (focus of this presentation) * Recommend using the suite of available data sources
GCM Downscaled
Experimental Design for Regional Climate Modeling • THREE GCMs • CCSM4, CNRM5, GFDL-CM3 • TWO RCMs • WRF, NHM-RSM • TWO 20 year periods • 1986-2005 (past) • 2040-2060 (future) • RCP 8.5 – high fossil fuel emissions scenario
First question to ask :How well do we simulate the historical climate?Maximum2-m Temperature annual average over P.R. -0.9°C -0.5°C -2.7°C
Maximum2-m Temperature Change annual average
Precipitation Change percent change for the annual total
Precipitation Change during Wet Season (April-October) South to North crossing El Yunque Rainforest
Example of Ongoing Analysis ECOREGION ANALYSIS - Diurnal Cycle of Precipitation Subtropical wet forest – Dark Green