Download
1 / 11
110 likes | 249 Views
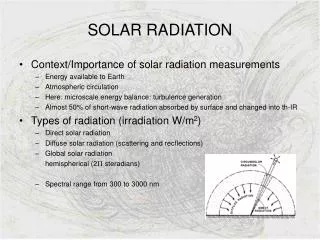
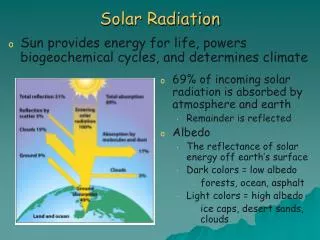
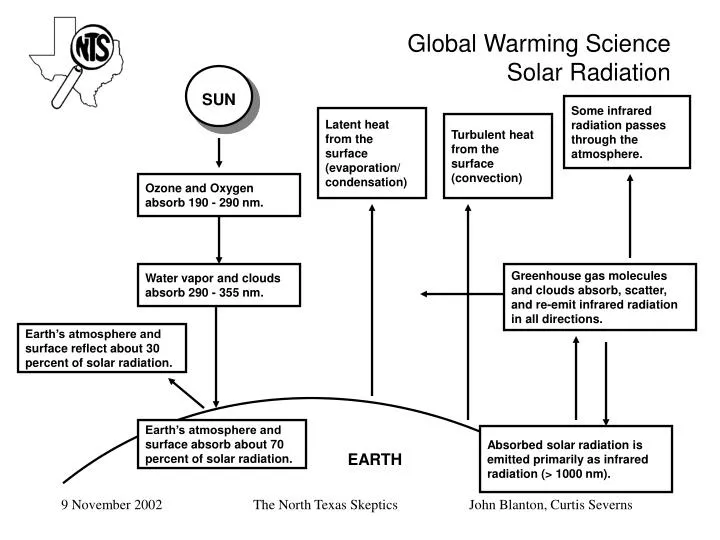
SUN. Global Warming Science Solar Radiation. Some infrared radiation passes through the atmosphere. Latent heat from the surface (evaporation/ condensation). Turbulent heat from the surface (convection). Ozone and Oxygen absorb 190 - 290 nm. Water vapor and clouds absorb 290 - 355 nm.

E N D
SUN Global Warming ScienceSolar Radiation Some infrared radiation passes through the atmosphere. Latent heat from the surface (evaporation/ condensation) Turbulent heat from the surface (convection) Ozone and Oxygen absorb 190 - 290 nm. Water vapor and clouds absorb 290 - 355 nm. Greenhouse gas molecules and clouds absorb, scatter, and re-emit infrared radiation in all directions. Earth’s atmosphere and surface reflect about 30 percent of solar radiation. Earth’s atmosphere and surface absorb about 70 percent of solar radiation. Absorbed solar radiation is emitted primarily as infrared radiation (> 1000 nm). EARTH The North Texas Skeptics John Blanton, Curtis Severns
Global Warming ScienceBlack Body Radiation fmax = xT (Wein’s displacement law) http://www.egglescliffe.org.uk/physics/astronomy/blackbody/bbody.html The North Texas Skeptics John Blanton, Curtis Severns
O C O Global Warming ScienceCO2 Quantum Mechanics The North Texas Skeptics John Blanton, Curtis Severns
Global Warming ScienceCO2 Absorption Spectrum http://webbook.nist.gov/cgi/cbook.cgi?ID=C124389&Units=SI/&Mask=80 The North Texas Skeptics John Blanton, Curtis Severns
Global Warming ScienceGlobal Warming Potential http://yosemite.epa.gov/oar/globalwarming.nsf/content/EmissionsNationalGlobalWarmingPotentials.html The North Texas Skeptics John Blanton, Curtis Severns
Global Warming ScienceGW Gasses and Temperature—History This graph shows the increase in the atmospheric concentration of Carbon dioxide (CO2), methane (CH4) and Antarctic temperature from 420,000 years ago until prior to the industrial revolution. The grey color represents CO2 concentrations, and the scale on the far left refers to the CO2 values. As can be seen in the graph to the left, pre-industrial levels (~280 ppmv) were similar to previous interglacials (times which were not considered an 'ice-age' - as now). The present, post-industrial atmospheric level of CO2 concentration is around 370ppmv, which on this graph would be off the scale. http://lwf.ncdc.noaa.gov/oa/climate/carbdiox.html The North Texas Skeptics John Blanton, Curtis Severns
Global Warming ScienceCO2 History http://lwf.ncdc.noaa.gov/img/climate/globalwarming/sio-mlgr.gif The North Texas Skeptics John Blanton, Curtis Severns
Global Warming ScienceThe Carbon Cycle http://www.whrc.org/science/carbon/carbon.htm The North Texas Skeptics John Blanton, Curtis Severns
Global Warming ScienceQuantified Carbon Cycle Atmospheric increase = Emissions from Fossil fuels + Net emissions from changes in land use - Oceanic uptake - Missing carbon sink 3.3(±0.2) = 5.5(±0.5) + 1.6(±0.7) - 2.0(±0.8) - 1.8(±1.2) http://www.whrc.org/science/carbon/carbon.htm The North Texas Skeptics John Blanton, Curtis Severns
Global Warming ScienceHuman Contribution The natural production and absorption of carbon dioxide (CO2) is achieved through the terrestrial biosphere and the ocean. However, humankind has altered the natural carbon cycle by burning coal, oil, natural gas and wood and since the industrial revolution began in the mid 1700s, each of these activities has increased in scale and distribution. Carbon dioxide was the first greenhouse gas demonstrated to be increasing in atmospheric concentration with the first conclusive measurements being made in the last half of the 20th century. Prior to the industrial revolution, concentrations were fairly stable at 280ppm. Today, they are around 370ppm, an increase of well over 30%. The atmospheric concentration has a marked seasonal oscillation that is mostly due to the greater extent of landmass in the northern hemisphere (NH) and its vegetation. A greater draw down of CO2 occurs in the NH spring and summer as plants convert CO2 to plant material through photosynthesis. It is then released again in the fall and winter as the plants decompose. http://lwf.ncdc.noaa.gov/oa/climate/gases.html#cd The North Texas Skeptics John Blanton, Curtis Severns
Global Warming ScienceGlobal Temperature History This graph shows annual mean global temperature anomalies over the period 1880-2001. The zero line represents the long term mean temperature from 1880-2001, and the red and blue bars are showing annual departures from that mean. As is evident in the graph, 2001 was second only to 1998 in terms of global temperature, and the trend has been toward increasing temperatures at least since the beginning of the 20th century. Land temperatures have greater anomalies than the ocean, which is to be expected since land heats up and cools down faster than water. http://lwf.ncdc.noaa.gov/oa/climate/globtemp.html The North Texas Skeptics John Blanton, Curtis Severns