Download
1 / 1
10 likes | 118 Views
Lower-tropospheric Ozone Derived from TOMS V7 Level-2 Data Xiong Liu, 1 Mike Newchurch, 1,2 and Jae Kim 1,3 1. Department of Atmospheric Science, University of Alabama, in Huntsville, USA 2. National Center for Atmospheric Research, Boulder, Colorado, USA

E N D
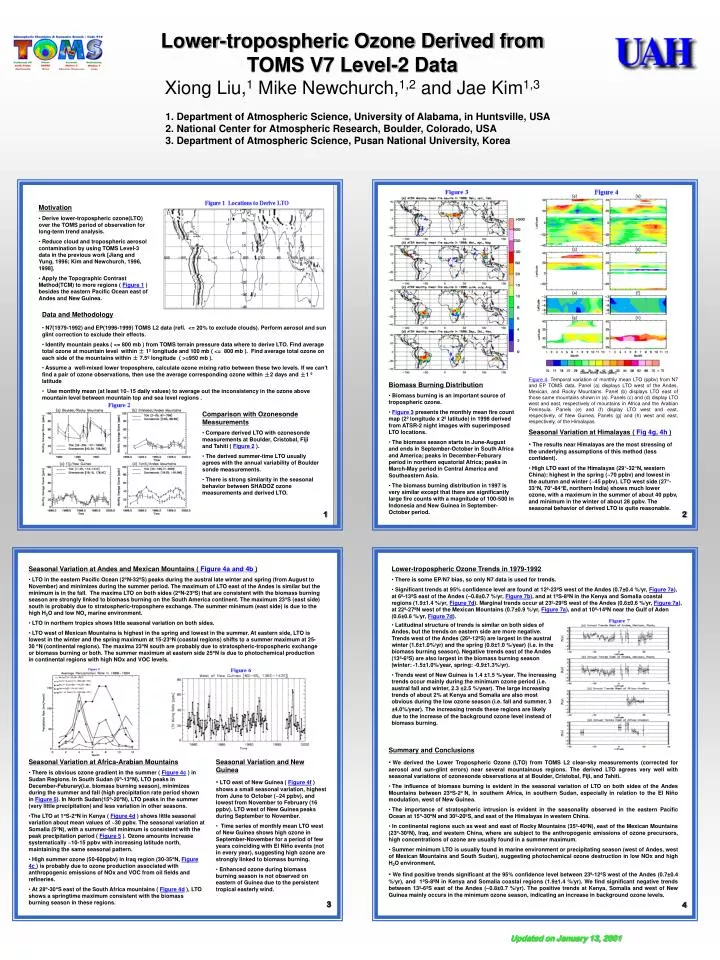
Lower-tropospheric Ozone Derived from TOMS V7 Level-2 Data Xiong Liu,1 Mike Newchurch,1,2 and Jae Kim1,3 1. Department of Atmospheric Science, University of Alabama, in Huntsville, USA 2. National Center for Atmospheric Research, Boulder, Colorado, USA 3. Department of Atmospheric Science, Pusan National University, Korea • Motivation • Derive lower-tropospheric ozone(LTO) over the TOMS period of observation for long-term trend analysis. • Reduce cloud and tropospheric aerosol contamination by using TOMS Level-3 data in the previous work [Jiang and Yung, 1996; Kim and Newchurch, 1996, 1998]. • Apply the Topographic Contrast Method(TCM) to more regions ( Figure 1 ) besides the eastern Pacific Ocean east of Andes and New Guinea. • Data and Methodology • N7(1979-1992) and EP(1996-1999) TOMS L2 data (refl. <= 20% to exclude clouds). Perform aerosol and sun glint correction to exclude their effects. • Identify mountain peaks ( <= 800 mb ) from TOMS terrain pressure data where to derive LTO. Find average total ozone at mountain level within ± 1º longitude and 100 mb ( <= 800 mb ). Find average total ozone on each side of the mountains within ± 7.5º longitude ( >=950 mb ). • Assume a well-mixed lower troposphere, calculate ozone mixing ratio between these two levels. If we can’t find a pair of ozone observations, then use the average corresponding ozone within ±2 days and ±1 º latitude • Use monthly mean (at least 10~15 daily values) to average out the inconsistency in the ozone above mountain level between mountain top and sea level regions . Figure 4. Temporal variation of monthly mean LTO (ppbv) from N7 and EP TOMS data. Panel (a) displays LTO west of the Andes, Mexican, and Rocky Mountains. Panel (b) displays LTO east of those same mountains shown in (a). Panels (c) and (d) display LTO west and east, respectively of mountains in Africa and the Arabian Peninsula. Panels (e) and (f) display LTO west and east, respectively, of New Guinea. Panels (g) and (h) west and east, respectively, of the Himalayas. • Biomass Burning Distribution • Biomass burning is an important source of tropospheric ozone. • Figure 3 presents the monthly mean fire count map (2º longitude x 2º latitude) in 1998 derived from ATSR-2 night images with superimposed LTO locations. • The biomass season starts in June-August and ends in September-October in South Africa and America; peaks in December-Feburary period in northern equatorial Africa; peaks in March-May period in Central America and Southeastern Asia. • The biomass burning distribution in 1997 is very similar except that there are significantly large fire counts with a magnitude of 100-500 in Indonesia and New Guinea in September-October period. • Comparison with Ozonesonde Measurements • Compare derived LTO with ozonesonde measurements at Boulder, Cristobal, Fiji and Tahiti ( Figure 2 ). • The derived summer-time LTO usually agrees with the annual variability of Boulder sonde measurements. • There is strong similarity in the seasonal behavior between SHADOZ ozone measurements and derived LTO. • Seasonal Variation at Himalayas ( Fig 4g, 4h ) • The results near Himalayas are the most stressing of the underlying assumptions of this method (less confident). • High LTO east of the Himalayas (29°-32°N, western China): highest in the spring (~70 ppbv) and lowest in the autumn and winter (~45 ppbv). LTO west side (27°-33°N, 70°-84°E, northern India) shows much lower ozone, with a maximum in the summer of about 40 ppbv, and minimum in the winter of about 28 ppbv. The seasonal behavior of derived LTO is quite reasonable. 1 2 • Seasonal Variation at Andes and Mexican Mountains ( Figure 4a and 4b ) • LTO in the eastern Pacific Ocean (2N-32S) peaks during the austral late winter and spring (from August to November) and minimizes during the summer period. The maximum of LTO east of the Andes is similar but the minimum is in the fall. The maxima LTO on both sides (2N-23S) that are consistent with the biomass burning season are strongly linked to biomass burning on the South America continent. The maximum 23S (east side) south is probably due to stratospheric-troposphere exchange. The summer minimum (east side) is due to the high H2O and low NOx marine environment. • LTO in northern tropics shows little seasonal variation on both sides. • LTO west of Mexican Mountains is highest in the spring and lowest in the summer. At eastern side, LTO is lowest in the winter and the spring maximum at 15-23N (coastal regions) shifts to a summer maximum at 25-30 N (continental regions). The maxima 23N south are probably due to stratospheric-tropospheric exchange or biomass burning or both. The summer maximum at eastern side 25N is due to photochemical production in continental regions with high NOx and VOC levels. • Lower-tropospheric Ozone Trends in 1979-1992 • There is some EP/N7 bias, so only N7 data is used for trends. • Significant trends at 95% confidence level are found at 12º-23ºS west of the Andes (0.7±0.4 %/yr, Figure 7a), at 6º-13ºS east of the Andes (–0.8±0.7 %/yr, Figure 7b), and at 1ºS-8ºN in the Kenya and Somalia coastal regions (1.9±1.4 %/yr, Figure 7d). Marginal trends occur at 23º-29ºS west of the Andes (0.6±0.6 %/yr, Figure 7a), at 22º-27ºN west of the Mexican Mountains (0.7±0.9 %/yr, Figure 7a), and at 10º-14ºN near the Gulf of Aden (0.6±0.6 %/yr, Figure 7d). • Latitudinal structure of trends is similar on both sides of Andes, but the trends on eastern side are more negative. Trends west of the Andes (26º-12ºS) are largest in the austral winter (1.6±1.0%/yr) and the spring (0.8±1.0 %/year) (i.e. in the biomass burning season). Negative trends east of the Andes (13º-6ºS) are also largest in the biomass burning season (winter: -1.5±1.0%/year, spring: -0.9±1.3%/yr). • Trends west of New Guinea is 1.4 ±1.5 %/year. The increasing trends occur mainly during the minimum ozone period (i.e. austral fall and winter, 2.3 ±2.5 %/year). The large increasing trends of about 2% at Kenya and Somalia are also most obvious during the low ozone season (i.e. fall and summer, 3 ±4.0%/year).The increasing trends these regions are likely due to the increase of the background ozone level instead of biomass burning. • Summary and Conclusions • We derived the Lower Tropospheric Ozone (LTO) from TOMS L2 clear-sky measurements (corrected for aerosol and sun-glint errors) near several mountainous regions. The derived LTO agrees very well with seasonal variations of ozonesonde observations at at Boulder, Cristobal, Fiji, and Tahiti. • The influence of biomass burning is evident in the seasonal variation of LTO on both sides of the Andes Mountains between 23oS-2o N, in southern Africa, in southern Sudan, especially in relation to the El Niño modulation, west of New Guinea. • The importance of stratospheric intrusion is evident in the seasonality observed in the eastern Pacific Ocean at 15-30N and 30º-20ºS, and east of the Himalayas in western China. • In continental regions such as west and east of Rocky Mountains (35º-40ºN), east of the Mexican Mountains (23o-30ºN), Iraq, and western China, where are subject to the anthropogenic emissions of ozone precursors, high concentrations of ozone are usually found in a summer maximum. • Summer minimum LTO is usually found in marine environment or precipitating season (west of Andes, west of Mexican Mountains and South Sudan), suggesting photochemical ozone destruction in low NOx and high H2O environment. • We find positive trends significant at the 95% confidence level between 23º-12ºS west of the Andes (0.7±0.4 %/yr), and 1ºS-8ºN in Kenya and Somalia coastal regions (1.9±1.4 %/yr). We find significant negative trends between 13º-6ºS east of the Andes (–0.8±0.7 %/yr). The positive trends at Kenya, Somalia and west of New Guinea mainly occurs in the minimum ozone season, indicating an increase in background ozone levels. • Seasonal Variation at Africa-Arabian Mountains • There is obvious ozone gradient in the summer ( Figure 4c ) in Sudan Regions. In South Sudan (6-13N), LTO peaks in December-Feburary(i.e. biomass burning season), minimizes during the summer and fall (high precipitation rate period shown in Figure 5). In North Sudan(15-20N), LTO peaks in the summer (very little precipitation) and less variation in other seasons. • The LTO at 1S-2N in Kenya ( Figure 4d ) shows little seasonal variation about mean values of ~30 ppbv. The seasonal variation at Somalia (5oN), with a summer-fall minimum is consistent with the peak precipitation period ( Figure 5 ). Ozone amounts increase systematically ~10-15 ppbv with increasing latitude north, maintaining the same seasonal pattern. • High summer ozone (50-60ppbv) in Iraq region (30-35N, Figure 4c) is probably due to ozone production associated with anthropogenic emissions of NOx and VOC from oil fields and refineries. • At 28-30S east of the South Africa mountains ( Figure 4d ), LTO shows a springtime maximum consistent with the biomass burning season in these regions. • Seasonal Variation and New Guinea • LTO east of New Guinea ( Figure 4f ) shows a small seasonal variation, highest from June to October (~24 ppbv), and lowest from November to February (16 ppbv). LTO west of New Guinea peaks during September to November. • Time series of monthly mean LTO west of New Guinea shows high ozone in September-November for a period of few years coinciding with El Niño events (not in every year), suggesting high ozone are strongly linked to biomass burning. • Enhanced ozone during biomass burning season is not observed on eastern of Guinea due to the persistent tropical easterly wind. 3 4 Updated on January 13, 2001