Download
1 / 18
180 likes | 370 Views
Modeling Ozone Depletion -TOMS Data (NASA) for Latitude Bands. Dan Seth, Math, MCP West Texas A&M University. Table of contents. What/Where is TOMS What got me started looking at Ozone data modeling Courses in which Ozone data is integrated

E N D
Modeling Ozone Depletion -TOMS Data (NASA) for Latitude Bands Dan Seth, Math, MCP West Texas A&M University
Table of contents • What/Where is TOMS • What got me started looking at Ozone data modeling • Courses in which Ozone data is integrated • Sample student work and project goal from the Integrated Math and Science courses • Acknowledgements and references
What is/where is TOMS (NASA)?It is now at ozoneaq http://ozoneaq.gsfc.nasa.gov/ http://npp.gsfc.nasa.gov/omps.html SuomiNPP is NASA's next Earth-observing research satellite. Whatsin a name: Why Suomi-NPP? NASA renamed NPP in honor of the late Verner E. Suomi, U. of Wisconsin, recognized widely as "the father of satellite meteorology." http://ozonewatch.gsfc.nasa.gov/ Ozone Hole Watch Images, data, and information for the Southern Hemisphere Ozone Maps Meteorology Ozone Facts Multimedia Education
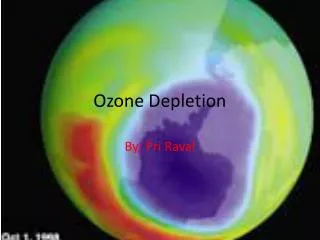
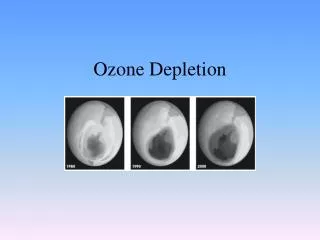
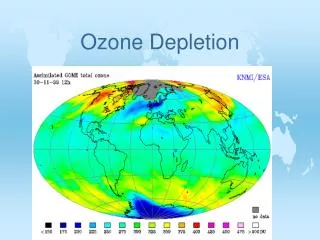
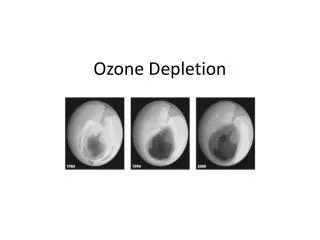
From a student favorite site: Ozone Hole WatchThe largest ozone hole: 24 September 2006.
Where it all began • Developed : 331,613 - Integrated Math and Science for Teachers • NASA-NOVA grant. • Integrated mathematics, science, and technology • pre-service elementary and middle, in-service high school teachers • Goals: • Strengthen math and science content knowledge • Develop understanding of interconnections between math and science • Provide experience with innovative teaching strategies • Integrate technology to enhance learning and improve instruction • Strengthen integration of national science and mathematics standards • Use data from NASA Strategic Enterprises to enhance learning • Team taught by: Robert Boram, Physical Science; Karen Lafferty, Education; Daniel Seth, Math Sciences
Classroom Integration - WTAMU • Courses where Ozone data is integrated. Students make predictions and discuss relevance to their lives and the future of the planet. • College algebra – regression : linear functions from real data • Math for liberal arts – linear regression models of real data • Linear algebra (least squares theory – generalized inverse) • Future course integrations : • Elementary/engineering statistics (get data, analyze it and test regression models) • linear algebra lab (get data, develop ozone level models for cities around the world and/or ozone hole area models) • Integrated math and science for teachers – collect data and develop models, by groups, for latitude bands
In-Class Pre-Project to retrieve and plot TOMS data. • Get ozone data from TOMS (Total Ozone Mapping Spectrometer instruments) • Plot ozone levels for two years for different latitude bands. • 1997-1998 monthly ozone averages latitude bands: • –35 to –30 • +30 to +35 • averaged levels
Ozone Project with NASA TOMS Data • Project goals: • Model change in ozone layer over past several years. • Develop equations modeling annual ozone levels of latitude bands around the earth. • Predict future ozone levels and climatological changes. • Group Activity: • Each group is assigned a latitude band around the earth. • Determine scatter plots: years vs. average ozone levels, determine least squares regression models, use model equations to predict future ozone levels of the latitude band. • Collect models for other latitude bands from other groups.
Ozone Project with NASA TOMS Data • Technology: • Ozone data was collected from TOMS ozone data archives ( http://toms.gsfc.nasa.gov/). • EXCEL - process data, make scatter plots, determine regression model equations • EXCEL and the TI-83 graphing calculator - make predictions, evaluate the model equations for future time values, in years. • Latitude bands: • –70 through –50; –50 through –30; –30 through –10; • –10 through +10; +10 through +30; +30 through +50; • and +50 through +70
Sample Annually Averaged Student Data Set NASA TOMS – Latitude band: 50-70
Student Displayed ProjectsMath_Sci 331 • Ozone Project power point: Bays, Deopke, Roark • Ozone Project poster: -30 to -10 group • Ozone Project power point: -10 to +10 group
Group Projects – Math_Sci 631 • Latitude Band:+50 to +70 • Model: y = -0.6597x + 1672.6 • R squared value: 0.4552 • Group comments: • Between 2009 to 2024, model shows little change in ozone levels. Studies conducted recently by the EPA suggest the opposite is true for this prediction. They have found evidence that the ozone layer is getting thinner is this band. • Prediction of Future Ozone Levels
Group Projects – Math_Sci 631 • Latitude Band:-10 to 10 • Model: y = -0.0373x + 335.19 • R squared value: 0.0039 • Group comments: • R value of 0.0039 means that our data has not been modeled very well by our regression equation. • Prediction of Future Ozone Levels
Acknowledgements • "The data used in this effort were acquired as part of the activities of NASA's Science Mission Directorate, and are archived and distributed by the Goddard Earth Sciences (GES) Data and Information Services Center (DISC).“ • Robert Boram, Department of Physical Sciences, Morehead State University, and I developed the course wherein this material was initially put together. The effort was funded under the NASA NOVA program.
References • ozoneaq: http://ozoneaq.gsfc.nasa.gov/ • Suomi NPP is NASA's next Earth-observing research satellite : http://npp.gsfc.nasa.gov/omps.html • Ozone Hole Watch : http://ozonewatch.gsfc.nasa.gov/ • TOMS The Total Ozone Mapping Spectrometer (TOMS) : http://mirador.gsfc.nasa.gov/cgi-bin/mirador/presentNavigation.pl?tree=project&project=TOMS • Goddard Earth Sciences Data and Information Services Center; Ozone: OVERVIEW : http://disc.sci.gsfc.nasa.gov/ozone