Download
1 / 39
390 likes | 396 Views
TOPAZ monitoring and forecasting system. L. Bertino, K. A. Lis æ ter F. Counillon, (NERSC) http://topaz.nersc.no. Acknowledgement developments funded by projects. European Commission DIADEM (Mast-III 1998-2000), TOPAZ (FP5 2000-2003) MERSEA IP (FP6 2004-2008) ESA

E N D
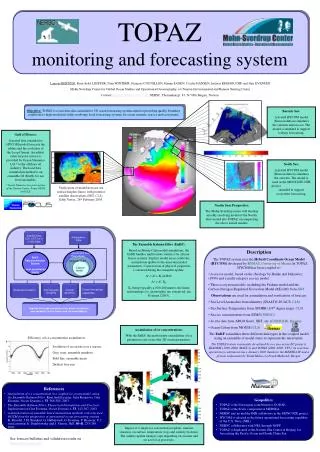
TOPAZmonitoring and forecasting system L. Bertino, K. A. Lisæter F. Counillon, (NERSC) http://topaz.nersc.no
Acknowledgement developments funded by projects • European Commission • DIADEM (Mast-III 1998-2000), • TOPAZ (FP5 2000-2003) MERSEA IP (FP6 2004-2008) • ESA • SIREOC (2001-2002), • EMOFOR (2003-2005) Gulf of Mexico service. • Industry, Ocean Numerics (NWAG, WANE…) • Norwegian research council
The ingredients • 3D numerical ocean model • HYCOM (U. Miami, USA) • Sea Ice model [Lisæter 2003] • Biogeoch. model (AWI, D) • Observations • Altimetry, SST (CLS, F) • Sea Ice (NSIDC, USA) • In-situ (CORIOLIS, F) • Data assimilation • Ensemble Kalman Filter [Evensen 1994, 2003, 2004]
A nested model system • Atlantic and Arctic: • 18-35 km resolution • Assimilates SLA, SST, ice c. • Provides large scale circulation • Downscaling: • high resolution regional models (2 – 5 km) • Local assimilation systems • A flexible modular system used in hincast and forecast
ApplicationsHYCOM to HYCOM • Atlantic - Atlantic Margin - NWAG • Atlantic – Labrador Sea • Indian Ocean – Arabian Sea • North Atlantic – Arctic Ocean (Lisæther 2003) • Atlantic – West African (WANE) • Atlantic – Atlantic Margin – North Sea (MONCOZE) • Atlantic – Gulf of Mexico (TOPAZ/EMOFOR)
ApplicationsHYCOM to other models • Atlantic – North Sea (MONCOZE also) • Dumping nesting conditions at given points • Spline Interpolation in the vertical • Used at met.no in MIPOM/NORWECOM • For prediction of harmful algal blooms • Atlantic – North Sea / Norwegian Sea • Comparison with POM (met.no) and ROMS (IMR)
Advanced Data AssimilationHow observations should influence the model • The bottleneck of numerical forecast? • System control + spatial statistics • Ensemble Kalman filter • Ensemble representation of forecast uncertainty • Assumes errors in forcing fields and stratification • Robust and flexible (SLA, SST, ice concentrations and thickness, in-situ T-S profiles, Ocean colour, TB) • Code upgrades on http://www.nersc.no/~geir/EnKF/
Weekly Forecast Cycle d+30 Forecast Forecast d-7 d-0 Analysis Nowcast Analysis Nowcast • Atlantic, North Sea and Gulf of Mexico models • Same cycle • Atmospheric forcing fields from ECMWF (10d Forecast, reverts to Climatology 28 days)
SLA assimilation SLA innovations Jan 03 Dec 03
Using an exogenous Mean SSH Sea surface heights zonal averages 21/01/2003 03/02/2003 17/02/2003 03/03/2003
Upgrading SST observations • Upgrade in June 2003 • From Reynolds (1o) • To CLS 1/4th degree SST. • SST gaps • Cloud coverage • Gaps handled consistently by EnKF
17th Feb. 2004 nowcast Mean SST Variance
17th Feb. 2004 analysis Mean SST Variance
24th Feb. 2004 nowcast Mean SST Variance
24th Feb. 2004 analysisirregularity is not a problem! Mean SST Variance
Validation proceduresagainst in-situ measurements and climatology Averages by regions on http://topaz.nersc.no
Observations Real-time SSM/I TB (NSIDC) Sea Ice only added where the ocean can sustain it Needs consistent ocean T/S correction Impact on salinity is process dependent: Ice melting, transport through thermal fronts … EnKF more efficient than OI [ Lisæter et al., Ocean Dynamics 2003 ] Sea Ice assimilationinto coupled ocean – sea ice model
Real-time in TOPAZ since September 2003 Observed (SSM/I) TOPAZ forecast 3rd march 2004
Assimilation of sea-ice concs.Implementation details • No need to regenerate the ensemble • Use the existing ensemble • Ice ensemble in free run since January 2003 • No modification of the assimilation setup • Same EnKF code for SST, SLA, Ice concs. • Same variances of model errors
Numerical performances • The state space: 27 million parameters • SLA, SST, ice c.: ~230.000 measurements • Parallelization: OpenMP (now MPI) • Forecast (100 members 1 week) • 80% scaling on 400 CPUs • Only 12 CPUs needed to cycle in time • Analysis= 3 0.5 hon 4 CPU • 75% scaling
Generic EnKF Separate code Identical for all observations Applied to OPA model in ENACT New analysis schemes: One subroutine changed [ Evensen, 2004, subm. OD ] “On the fly” HYCOM upgrade (v2.1) Aligned with NRL Considerable Improvements cf. N. Winther No changes in EnKF New model spin-up From GDEM climatology New topography (Gebco2”) Upgrade MSSH Ongoing upgrades:offline data assimilation and nesting
More data assimilation Uncertain MSSH In-situ T/S ARGO, XBT (idle: dependent on MSSH) SMOS TB (evaluated) Ice thickness (evaluated) Geostatistical extensions Anamorphosis Bias estimation (correction to MSSH) Developments • Improved ecosystem model • C:N-REcoM • C and N decoupled • Explicit Chl compartment • Developed within TOPAZ • M. Schartau, AWI • Assimilation Ocean Colour • [ LJ. Natvik 2003 ] • Needs transfer from HYCOM1.3 to HYCOM2.1
What does the EnOI do? Nowcast Analysis
Nowcast Analysis Temperature sections
Nowcast Analysis Temperature sections
Nowcast Analysis Current sections
Eddy “Sargassum” episodeValidation of a monthly GOM forecast Observations (CLS) Forecasts Only the first map has been assimilated
Sea Surface Heightsforecast RMS errorsstandard depressing statistics Average on all ”Sargassum” runs
Forecast errorsdetails per run Spin-up No assimilation in TOPAZ !
Against in-situ measurements ACDP measurements Transects Simulate drifters Against EO data Posterior SSH maps Surface Temperature Ocean color Diagnostics Frontal distances Hit/miss ratios Eddy size Emulate drifters Routine validation procedures
North SeaMONCOZE Norwegian project • Soon in real-time • Aim: prediction of harmful algal blooms • Comparison with POM at met.no (MIPOM) • 4-km and 2-km res. • Advec.-momentum schemes more important! http://www.nersc.no/Projects/moncoze
Surface salinity North Sea+ at 4km resolutionNDP-funded CONMAN project • Intercomparison • HYCOM (NERSC) • ROMS (IMR) • POM (Met.no)
Ocean Numerics’ forecast service FOCUS Forecasting Ocean Currents Service Launch 5th May 2004 Free trial period for oil companies (4 months) Gulf of Mexico West African Coast (EMOFOR project, ESA) Applications • Further applications • Ice forecasts, ship routing, oil spills, environmental monitoring …
Thus the TOPAZ system is • User oriented with strong link to offshore industry • Serving standard data since June 2003 • http://topaz.nersc.no • Being compared to other operational systems • Mersea Strand1 (cf. Crosnier & Le Provost) • Comparison continued in MERSEA IP. • NERSC’s contribution to the • GMES (MERSEA) and GODAE initiatives • EuroGOOS task teams