Download

1 / 20
210 likes | 386 Views
JTAG and Multi-ICE. Speaker : 沈文中. National Taiwan University Adopted from National Taiwan University SOC Course Material. Outline. ARM debug Architecture Content of JTAG Content of Embedded ICE Multi-ICE Arch. ARM debug Arch.(I). AXD can debug design through: ARMulator(software)

E N D
JTAG and Multi-ICE Speaker :沈文中 National Taiwan University Adopted from National Taiwan University SOC Course Material
Outline • ARM debug Architecture • Content of JTAG • Content of Embedded ICE • Multi-ICE Arch.
ARM debug Arch.(I) • AXD can debug design through: • ARMulator(software) • Multi-ICE(hardware) • Angel(hardware)
ARM debug Arch.(II) • Limits of ARMulator • Processor core model • Memory interface • Coprocessor interface • Operating system interface
ARM debug Arch.(III) • Multi-ICE • The solution for ARMulator limits • Can emulate custom logic • Use hardware to emulate truly results • Extended from JTAG Architecture
Outline • ARM debug Architecture • Content of JTAG • Content of Embedded ICE • Multi-ICE Arch.
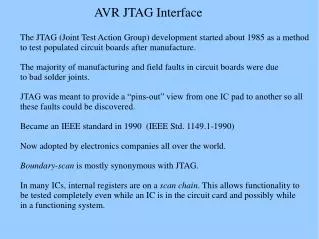
JTAG Arch. • Serial scan path from one cell to another • Controlled by TAP controller
JTAG Principle(II) • JTAG Signals • TRST Test reset signal • TDI Test data in • TMS Test mode select • TCK Test clock • TDO Test data out
Outline • ARM debug Architecture • Content of JTAG • Content of Embedded ICE • Multi-ICE Arch.
Debug extensions to the ARM core • The extensions consist of a number of scan chains around the processor core and some additional signals that are used to control the behavior of the core for debug purposes : • BREAKPT: enables external hardware to halt processor execution for debug purposes.active high • DBGRQ: is a level-sensitive input that causes the CPU to enter debug state when the current instruction has completed. • DBGACK: is an output from the CPU that goes high when the core is in debug state
The EmbeddedICE logic • This logic is the integrated onchip logic that provides JTAG debug support for ARM core. • This logic is accessed through the TAP controller on the ARM core using the JTAG interface. Consists of: • Two watchpoint units • A control register • A status register • A set of registers implementing the Debug Communications Channel link
Watch /break point • Watchpoints are taken when the data being watchpointed has changed. • Breakpoints are taken when the instruction being breakpointed reaches the execution stage. the program counter is not updated, and retains the address of the breakpointed instruction.
Outline • ARM debug Architecture • Content of JTAG • Content of Embedded ICE • Multi-ICE Arch.
Multi-ICE(II) • Debugging software can be run on different computer through Network.
The portmap application • To support network connections, an additional application must be running on the windows workstation that runs the The multi-ICE server. • the portmapper allows software on other computers on the network to locate the The multi-ICE server.
How multi-ICE differs from a debug monitor • A debug monitor is an application that runs on your target hardware in conjunction with your application, and requires some resources(ex:memory) to be avaible • The EmbeddedICE debug arch. Requires almost no resources. Rather than being an application on the board, it works by using : • Additional debug hardware within the core, parts that enable the host to communicate with the target • An external interface unit that buffers and translates the core signals into something usable by a host computer
Multi-ICE [DUI_0048F_MICE2_2_UG] AXD and armsd Debuggers Guide [DUI_0066D_AXDDG_2_UG ] Getting Started Guide [DUI_0064D_GSG_UG ] Reference Topic & Related Documents