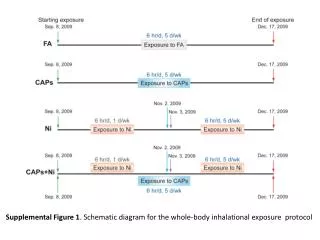
Download
1 / 13
130 likes | 355 Views
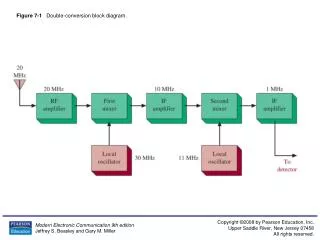
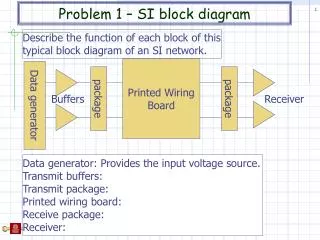
ICD Scintillator Tile. Fiber Optic Cable. PMT High Voltage Supply (see Figure 4 & 4a). UTA Fiber Backplane. Fiber Optic Cable. Light Tight Coupling. LED Pulser PMT Calibration (see Figure 6). PMTs. ICD Light Tight Electronics Box. ICD Motherboard (see Figures 2 & 3). PMT base.

E N D
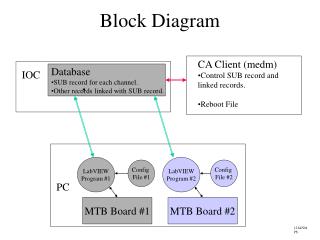
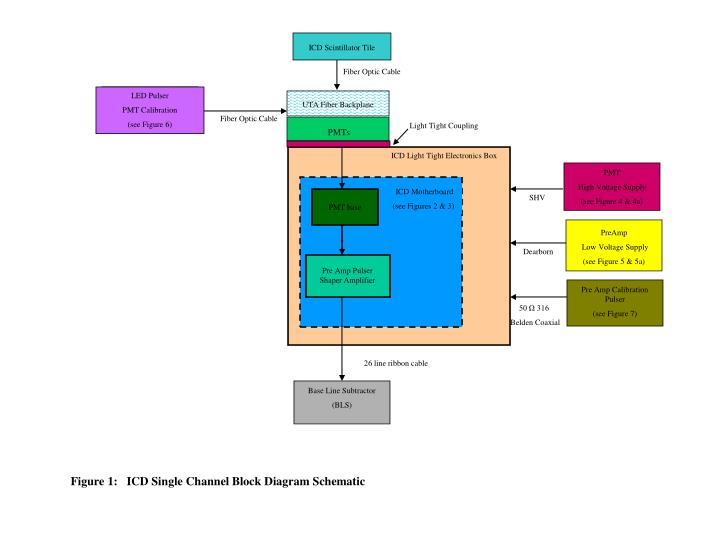
ICD Scintillator Tile Fiber Optic Cable PMT High Voltage Supply (see Figure 4 & 4a) UTA Fiber Backplane Fiber Optic Cable Light Tight Coupling LED Pulser PMT Calibration (see Figure 6) PMTs ICD Light Tight Electronics Box ICD Motherboard (see Figures 2 & 3) PMT base SHV PreAmp Low Voltage Supply (see Figure 5 & 5a) Dearborn Pre Amp Pulser Shaper Amplifier 50 Ω 316 Belden Coaxial Pre Amp Calibration Pulser (see Figure 7) 26 line ribbon cable Base Line Subtractor (BLS) Figure 1: ICD Single Channel Block Diagram Schematic
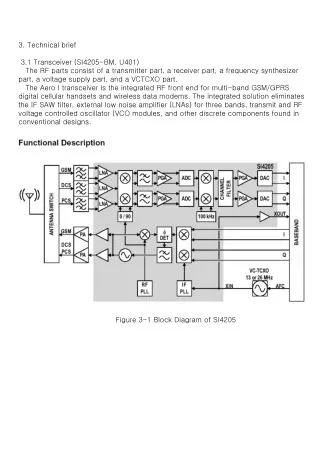
ICD Scintillator Tile ICD Light Tight Box Pre-Amps (Pulser shaper amplifiers) LED Pulser PMT Calibration PMT Base HV Supply Output to BLS PMT Base Analog motherboard output. Positive going pulse with the following characteristics: ~200 ns risetime @ 20 & 80% ~19 μs falltime @ 20 & 80% Pulse height between 10 and 200 mV depending on PMT signal output PreAmp PMT Base PreAmp PMT Base PreAmp PreAmp PreAmp Calibration Pulser PMT Base PreAmp PMT Base La Tech Motherboard UTA Fiber Cable Backplane PMTs PreAmp PreAmp LV Supply PMT Base Figure 2: La Tech ICD Motherboard
Input Signals from PMTs PMT Base Plugin PMT HV Supply Input PreAmp Plugin Processed PMT Signals out to BLS PreAmp LV Supply Input PreAmp Calibration Pulser Input Figure 2a: Picture of the production ICD Motherboard with inputs and outputs marked
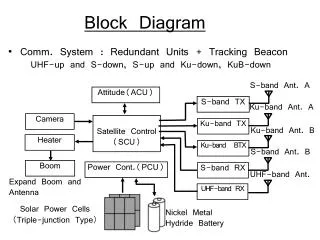
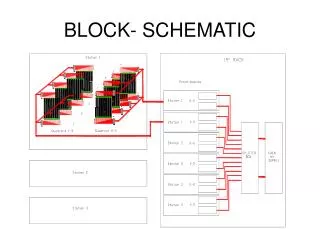
ICD Electronics Crate Iron Box (X4) Motherboards (UTA) Fiber Back Plane (X4) 6 PMTs per Motherboard 16 Light Tight Boxes containing Motherboards Figure 3: Layout of ICD Crate Electronics and Motherboard
MOD Maryland Box (X8) 1-to-3 HV Fanout Board (shown in Figure 4a) SHV Cables 16 channels Run I HV POD (X16) 8 Outputs @+1000-800 VDC Individual FUSES on HV output tp PMTs (see Figure 4a) Variable Resistors on output 48 channel output on Six 8-conductor Reynolds cables Old Maryland Box (X24) 1-to-1 Fanout SHV Cable To ICD Motherboard Figure 4: High Voltage Supply Block Diagram
Fuse Fuse Fuse Figure 4a: Circuit Diagram for the High Voltage Fanout Board
LV Power Supply Box 4 Power Cables Each cable holds all three voltages La Tech LV Fanout Board (shown in Figure 5a) Fermi Low Voltage PS (X1) Supplies: +12 VDC -6 VDC +8 VDC Fuses (see Figure 5a) 64 Low Voltage Dearborne Cables To ICD Motherboard Figure 5: Low Voltage Power Supply Block Diagram
R2 R4 -12 V -6 V 1k 2k -8 V -12 V DC/DC Converter R1 R3 12 V Input 1k 1k DFA20E12D12 F1 Fuse Ground F3 Fuse F3 Fuse F3 Fuse F2 Fuse F2 Fuse F2 Fuse 12 V 8V 6V F1 Fuse F1 Fuse F1 Fuse -6V -6V -6V 8V 8V 8V 16 Output Sets 12V 12V 12V + + + - - - Figure 5a: Circuit Diagram for the Low Voltage Fanout Board
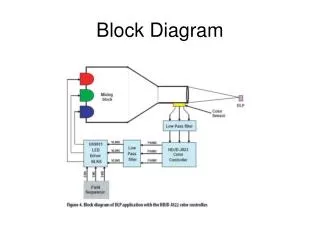
12 channels, each limited to 2.5 V maximum output. X4 opamp and resistively added for a 10 V max output. 2 delay lines of 8 20ns steps and 16 2ns steps. Fermi LED Pulser (X4) Fermi VME Crate Scintillator LED Pulser (SLP) Scintillator Front End (SFE) LED To PMTs Light Mixer Block Scintillator Readout Controller (SRC) OpAmp Monitor Pin diode Output Signal to ADC Power Supply Cord Cu Box Op Amp Power Supply Optical Fibers to PMTs To PMTs via UTA Fiber Backplane Figure 6: PMT LED Calibration Pulser Diagram
DC Current between 0 and 80 mA French Pulser Fanout Board (X4) French Pulser Driver Board X1 Pulser Supply Amplitude of Calibration Pulse 16 Switches X2 out (Located In LV Fanout Box) 50 Ω SMA 316 Belden Coaxial Cables (X128) To La Tech ICD Motherboard Command Line ECL Pulse (digital) Out going pulse characteristic: 50 μs Level of DC Current Output of Pulser Driver VME Crate The first 400 ns of this pulse are useful. The strength of the pulse ranges between 0 and 3 V. Pulser Interface Board (PIB) Pulse Supply Controller Figure 7: PreAmp Calibration Pulser Diagram
ICD ICD Bottom Central Calorimeter Cable tray & winder Cable Chutes (not visible from this angle) Electronics Racks 20 feet Merge Area (BLS) (not visible from this angle) Central Platform floor View of Rack Layout on Central Platform Hole in iron to access central platform PW09 PW04 PW05 New rack was installed in Feb ~6 ft tall/2 ft wide - #6 to be used for ICD 1553 T. trans HV Pulser HV, Pulser cables to chute (fake floor) Slight overhang (racks are welded to floor) Figure 8: Plat Form Layout of ICD Racks
Upper Cable Tray ICD Crate Lower Cable Tray D0 North End Face of Endcap Calorimeter ICD Box (Contains 12 Tiles) ICD Scintillator Tiles Notes: 1. There are 16 ICD Boxes for each End with 12 Scintillator Tiles in each (gives 12x16=192 signal channels per end) 2. Connection from Tiles to ICD Crates is through a 5m long Fiber Cable 3. There are 2 ICD Electronics Crates each contains 16 ICD Electronics Boxes 4. Each ICD Electronics Box handles 6 PMTs (2 ICD Electronics boxes per Tile) Fiber Cables Upper Cable Tray ICD Crate Iron Boxes ( surrounds PMTs) View Looking South LV Fanout Boxes Lower Cable Tray Figure 9: Inner Cryostat Detector System - ICD
Top View ICD Crate PMTs Maryland Boxes Side View ICD Light Tight Electronics Boxes Existing Cable Trays ICD Crate Iron box Maryland Boxes Front ICD Crate Figure 10: Expanded view of ICD Layout with dimensions.