Download
1 / 53
560 likes | 846 Views
QUALITY CONTROL AND SPC. CHAPTER 16. DAVID A. COLLIER AND JAMES R. EVANS. LO1 Describe quality control system and key issues in manufacturing and service. LO2 Explain types of variation and the role of statistical process control .

E N D
QUALITY CONTROL AND SPC CHAPTER 16 DAVID A. COLLIER AND JAMES R. EVANS
LO1Describe quality control system and key issues in manufacturing and service. LO2Explain types of variation and the role of statistical process control. LO3Describe how to construct and interpret simple control charts for both continuous and discrete data. LO4Describe practical issues in implementing SPC. LO5Explain process capability and calculate process capability indexes.
marriott has become infamous for its obsessively detailed standard operating procedures (SOPs), which result in hotels that travelers either love for their consistent good quality or hate for their bland uniformity. “This is a company that has more controls, more systems, and more procedural manuals than anyone—except the government,” says one industry veteran. “And they actually comply with them.” Housekeepers work with a 114-point checklist. One SOP: Server knocks three times. After knocking, the associate should immediately identify themselves in a clear voice, saying, “Room Service!” The guest’s name is never mentioned outside the door. Although people love to make fun of such procedures, they are a serious part of Marriott’s business, and SOPs are designed to protect the brand. Recently, Marriott has removed some of the rigid guidelines for owners of hotels it manages, empowering them to make some of their own decisions on details.
What do youthink? What opportunities for improved quality control or use of SOPs can you think of at your college or university (e.g., bookstore, cafeteria)?
The task of quality control is to ensure that a good or service conforms to specifications and meets customer requirements by monitoring and measuring processes and making any necessary adjustments to maintain a specified level of performance.
Quality Control Systems • Quality Control Systems have three components: • A performance standard or goal. • A means of measuring actual performance. • Comparison of actual performance with the standard to form the basis for corrective action.
Quality Control Systems 1:10:100 Rule: If a defect or service error is identified and corrected in the design stage, it might cost $1 to fix. If it is first detected during the production process, it might cost $10 to fix. However, if the defect is not discovered until it reaches the customer, it might cost $100 to correct.
Quality Control Systems • Quality at the sourcemeansthe people responsible for the work control the quality of their processes by identifying and correcting any defects or errors when they first are recognized or occur.
Quality Control Systems • Quality Control Practices in Manufacturing • Supplier Certification and Management: Ensures conformance to requirements before value-adding operations begin. • In-Process Control: Ensures that defective outputs do not leave the process and prevents defects in the first place. • Finished Goods Control: Verifies that product meets customer requirements.
Quality Control Systems • Quality Control Practices in Services • Prevent sources of errors and mistakes by using poka-yoke approaches. • Hire and train service providers in service management skills. • Measure customer satisfaction.
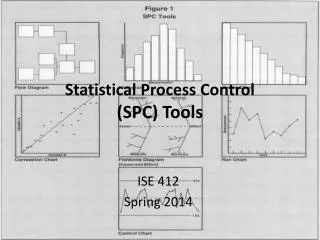
Statistical Process Control and Variation • Statistical process control (SPC)isa methodology for monitoring quality of manufacturing and service delivery processes to help identify and eliminate unwanted causes of variation.
Statistical Process Control and Variation • Common cause variationis the result of complex interactions of variations in materials, tools, machines, information, workers, and the environment. • Common cause variation accounts for 80 to 95 percent of the observed variation in a process. • Only management has the power to change systems and infrastructure that cause common cause variation.
Statistical Process Control and Variation • Special (assignable) cause variationarises from external sources that are not inherent in the process, appear sporadically, and disrupt the random pattern of common causes. • Special cause variation accounts for 15 to 20 percent of observed variation. • Front-line employees and supervisors have the power to identify and solve special causes of variation.
Statistical Process Control and Variation • If no special causes affect the output of a process, we say that the process is in control. • When special causes are present in a process, the process is said to be out of control.
Statistical Process Control and Variation Two basic mistakes when attempting to control a process: Adjusting a process that is already in control. Failing to correct a process that is out of control.
Constructing Control Charts • Preparation • Choose the metric to be monitored. • Determine the basis, size, and frequency of sampling. • Set up the control chart. • Data collection • Record the data. • Calculate relevant statistics: averages, ranges, proportions, and so on. • Plot the statistics on the chart.
Constructing Control Charts • Determination of trial control limits • Draw the center line (process average) on the chart. • Compute the upper and lower control limits. • Analysis and interpretation • Investigate the chart for lack of control. • Eliminate out-of-control points. • Recompute control limits if necessary.
Constructing Control Charts • Use as a problem-solving tool • Continue data collection and plotting. • Identify out-of-control situations and take corrective action. • Determination of process capability using the control chart data
Constructing Control Charts • A continuous metricis one that is calculated from data that are measured as the degree of conformance to a specification on a continuous scale of measurement. • A discrete metricisone that is calculated from data that are counted.
Constructing x- and R-Charts • Collect k = 25-30 samples of n = 3-10 observations each. • Compute the mean and range of each sample. • Compute the overall mean and average range: • Compute the control limits: [16.2] [16.1] [16.3]
Solved Problem Goodman Tire periodically tests its tires for tread wear under simulated road conditions. The company collects twenty samples, each containing three radial tires from different shifts over several days of operations. The overall mean is computed as 31.88, and the average range is 10.8.
Exhibit 16.1 Excel Template for Goodman Tire x-bar and R-Charts
Solved Problem Control limits are:
Interpreting Patterns in Control Charts A process is said to be “in control” when the control chart has the following characteristics: • No points are outside the control limits (the traditional and most popular SPC chart guideline). • The number of points above and below the center line is about the same. • The points seem to fall randomly above and below the center line. • Most points, but not all, are near the center line, and only a few are close to the control limits.
Interpreting Patterns in Control Charts Rules for identifying a shift in the process: 8 points in a row above or below the center line. 10 of 11 consecutive points above or below the center line. 12 of 14 consecutive points above or below the center line. 2 of 3 consecutive points in the outer one-third region between the center line and one of the control limits. 4 of 5 consecutive points in the outer two-thirds region between the center line and one of the control limits.
Exhibit Extra Illustration of Some Rules for Identifying Out-of-Control Conditions
Constructing p-Charts • A p-chart monitors the proportion of nonconforming items (also called a fraction nonconforming or fraction defective chart). • piis the fraction nonconforming in sample i. • Average fraction nonconforming: • Standard deviation: [16.4] [16.5]
Constructing p-Charts Control limits: [16.6]
Solved Problem The operators of automated sorting machines in a post office must read the ZIP code on letters and divert the letters to the proper carrier routes. Over a month’s time, 25 samples of 100 letters were chosen, and the number of errors was recorded. The average proportion defective, p is computed as 0.022. The standard deviation is: UCL = .022 + 3(.01467) = .066, and LCL = .022 - 3(.01467) = -.022. Since the LCL is negative and the actual proportion nonconforming cannot be less than zero, the LCL is set equal to zero.
Exhibit 16.4 Data and Calculations for the p-Chart Solved Problem
UCLc= c + 3 √ √ c c LCLc= c - 3 • Constructing c-charts • A c-chart monitors the number of nonconformances (i.e., a count of the number of defects or errors) per unit, when the size of the sampling unit or number of opportunities for errors is constant. • Example: A purchase order may have several errors, such as wrong items, order quantity, or wrong price. • c is the average number of nonconformances/unit. Control limits are given by: [16.7]
Solved Problem The total number of machine failures over a 25-day period is 45. The average number of failures per day, c, is 45/25 = 1.8. Control limits for the c-chart are:
Exhibit 16.6 Machine Failure Data for c-Chart Solved Problem
Practical Issues in SPC Implementation • Sample size: Small sample size keeps costs lower; however, large sample sizes provide greater degrees of statistical accuracy in estimating the true state of control. • In practice, samples of about 5 have been found to work well in detecting process shifts of 2 standard deviations or larger. To detect smaller shifts in the process mean, larger sample sizes of 15 to 25 must be used.
Practical Issues in SPC Implementation • Sampling frequency: Samples should be close enough to provide an opportunity to detect changes in process characteristics as soon as possible and reduce the chances of producing a large amount of nonconforming output. • Large samples on a frequent basis are normally not economical. • However, they should not be so frequent that the cost of sampling outweighs the benefits that can be realized. This decision depends on the individual application and volume of output.
Controlling Six Sigma Processes SPC is a useful methodology for processes that operate at a low sigma level (less than or equal to 3-sigma). For processes with a high sigma level (greater than 3-sigma), few defects will be discovered even with large sample sizes. More advanced tools are necessary.
Process Capability • Process capabilityrefers to the natural variation in a process that results from common causes. • A process capability studyis a carefully planned study designed to yield specific information about the performance of a process under specified operating conditions. • Typical questions: • Where is the process centered? • How much variability exists in the process? • Is the performance relative to specifications acceptable? • What proportion of output will be expected to meet specifications?
Process Capability Index The relationship between the natural variation and specifications is often quantified by a measure known as the process capability index. Cp = (UTL – LTL)[16.9] 6σ Where: UTL = Upper tolerance limit LTL = Lower tolerance limit σ = Standard deviation of the process (or an estimate based on the sample standard deviation, s)
Process Capability Index • When Cp = 1, the natural variation is the same as the design specification width. • When Cp< 1, a significant percentage of output will not conform to the specifications. • When Cp> 1, nearly all the output will conform to the specifications.
Exhibit 16.8 c-Process Capability versus Design Specifications
Process Capability Index • Many firms require Cp values of 1.66 or greater from their suppliers, which equates to a tolerance range of about 10 standard deviations. • The value of Cp does not depend on the mean of the process (it depends on the specification range and actual process standard deviation); thus, a process may be off-center, and still show an acceptable value of Cp.
Process Capability Index One-sided process capability indexes consider off-centering in a process: Cpu = (UTL – µ)/3σ (upper one-sided index) [16.10] Cpl= (µ – LTL)/3σ (lower one-sided index) [16.11] Cpk = min (Cpl, Cpu) [16.12]
Solved Problem A controlled process shows an overall mean of 2.50 and an average range of 0.42. Samples of size 4 were used to construct the control charts. If specifications are 2.60 ± 0.25, how well can this process meet them? What are the process capability indexes?