Download
1 / 27
270 likes | 399 Views
Data and correlation. E. Kusideł Demand Analysis. Condition s to apply statistical methods to demand analysis 1. Economic phenomena must be quantif ied Most of them are naturally quantified: prices, income, GDP, level of demand, production, etc.

E N D
E. Kusideł Demand Analysis Conditions to apply statistical methods to demand analysis 1. Economic phenomenamust be quantified • Most of them are naturally quantified: prices, income, GDP, level of demand, production, etc. • Some of them have not natural measure: properties of goods like quality, smell, color.
Condition to apply statistical methods 2. Statistical data are accessible and long enough • Sometimes we know that statistical data do exists but we have no access to them • Formally number of observations must be largerthat number of estimated parameters, but practically number of observations must be much larger that number of estimated parameters
Kinds of statistical data Time series data (TSD): xtfort=1,2,…,T. Cross-section or spatial data (CSD): xi fori=1,2,…,N. Panel data or cross-section time (PD): xitfor i=1,2,…,N; t=1,2,…,T.
An example of time series data: xt , t=1,2,…,T.Number of employees in Poland in period:1st quarter 1995 – 4th quarter 2006 t=1,2,…48 (12 years with 4 quarters in every year: 4x12=48 observations).
An example of cross-section data:xi, i=1,2,…,N.Number of employees in 4th quarter of 2006 in 16 regions of Poland i=1,…16 (number of regions in Poland).
An example of panel data: xiti=1,2,…,N; t=1,2,…,T.Number of employees in 6 regions of Poland measured in 4 quarters of 2006 i=1,…,6, t=1,…4. Number of observations: 4x6=24.
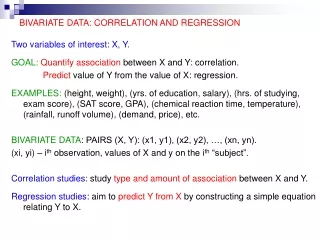
How to measure relationships between economic phenomena expressed in series of data? • Correlation coefficient • Elasticities • Regression analysis
Formula 1Correlation coefficient between two variables x and y n- sample amount, cov(x,y)- covariance between x i y, sx, sy, - standard deviation of variable x i y.
Properties of correlation coefficient -rxy rxy is a measure which can differ (vary) between –1 and 1. Module from rxy is a power of the relationship Sign of rxy inform us about direction of relationship
Sign of correlation coefficient rxy<0 – negative correlation (if x grows then y falls or if x falls then y grows) rxy>0 – positive correlation (if x grows then y grows or if x falls then y falls)
Power of correlation coefficient Module of rxy, value of which is between 0 and 1 informs us about power of relationship rxy = 0 - variables arenot connected (no connection, or no correlation). e.g. demand for woman bag is not correlated with demand for computers. rxy =1 – very strong connection between two variables e.g. we can expect strong relationship between demand for computer and demand for computers screen.
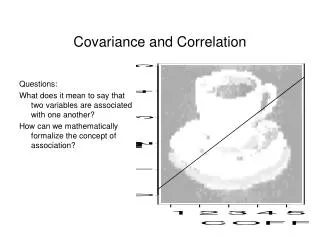
Scatter diagram The first step in most correlation problems is to construct a graphic picture of the relationship between the two variables. Such a picture is best provided by the a so-called scatter diagram
Scatter diagram:graph of relationships between price and demand for product A
Shape of scatter diagram Sign of CC • Growing line: positive correlation • Falling line: negative correlation Power of CC • The more straight scatter diagram is the greater power of CC • The more round the scatter diagram is the less power of CC. • Straight line, but perpendicular or parallel to an axis: no correlation
Task 1Draw a scatter diagram for priceB and demandB and income and demandA (data from demandAB.xls) And answer following question: 1. Is it the case of positive or negative correlation? 2. Is the correlation stronger then in case of product A?
Homework Calculate correlation coefficient between price and demand for product B using formula 1
Scatter diagram for price and demand for product B 1. Is it the case of positive or negative correlation? 2. Is the correlation stronger then in case of product A?