Download
1 / 59
590 likes | 866 Views
Hurricane type vortices in ECHAM5. How will they change in a warmer climate? Lennart Bengtsson with Kevin Hodges, ESSC Monika Esch and co-workers at MPI Tropical cyclones in a future climate what could be expected?

E N D
Hurricane type vortices in ECHAM5. How will they change in a warmer climate? Lennart Bengtsson with Kevin Hodges, ESSC Monika Esch and co-workers at MPI MPI for Meteorology Hamburg
Tropical cyclones in a future climatewhat could be expected? • Higher SST and higher atmospheric moisture would generally favor more intense storms ( e.g. Emanuel 1988, 1999) • This is supported by modeling results by Knutson and Tuleya (2004) driving an limited area model with CMIP2+ boundary data ( 9 different models). • Increasing vertical wind-shear and reduced relative humidity would counteract this tendency. Such influences occur in the tropical N. Atlantic during El Nino. • How will the number of storms change? What are the general conditions controlling the number of tropical storms? • What are the critical conditions in modeling tropical storms? Are results from large scale models with limited resolution credible? MPI for Meteorology Hamburg
After Emanuel MPI for Meteorology Hamburg
Modeling approach • Simulation of tropical cyclones per se in a global GCM • Using limited area models at high resolution • Identifying climate predictors in a GCM (SST, vorticity, static stability, relative humidity, vertical wind-shear) MPI for Meteorology Hamburg
Simulation of tropical cyclones per se in a global GCM • Disadvantage: Difficulties to resolve the intense features of a tropical storm • Examples of studies: Bengtsson et al. 1995, 1996, Tellus Sugi et al. 2002, JMS, Japan McDonald et al. 2005, Clim.Dyn. Chauvin et al. 2006, Clim Dyn. Oouchi et al. 2006, JMS, Japan Yoshimori et al. 2006, JMS, Japan MPI for Meteorology Hamburg
Simulation of hurricane type vortices with a GCM • Typical criteria: • An identifiable vortex • A minimum in the surface pressure • Surface wind speed above a given value • A warm core vortex ( reduced circulation with height) MPI for Meteorology Hamburg
Effect of 2xCO2 From Bengtsson et al., 1996 (Tellus) ( number of cyclones /basin) MPI for Meteorology Hamburg
Using limited area models at high resolution • Disadvantages: Generation of storms, Large scale influences difficult to handle • Examples of studies: Knutson et al. 1998, Science Knutson and Tuleya, 1999, Clim. Dyn. Knutson and Tuleya, 2004, J Clim. MPI for Meteorology Hamburg
Impact of CO2-induced warming on simulated hurricane intensityKnutson and Tuleya (2004, J of Climate) • They used a high resolution limited area model driven by the SST and moisture of 9 CGCM from the CMIP 2+ project. • CMIP2 uses 1%yr-1 increase over an 80-year period implying an increase by a factor of 2.2. • Model calculations are undertaken in NW Pacific-, NE Pacific- and Atlantic basin • Four different convective schemes are tested (no significant differences) • RESULTS: • Max. surface wind speed increases by 6% • Min. central pressure by 14% • Max. precipitation by 24% • Hurricane increase by a factor of 1/2 in the Simpson-Saffir scale MPI for Meteorology Hamburg
Intensification of hurricanes at 2xCO2Knutson and Tuleya (2004) MPI for Meteorology Hamburg
Identifying climate predictors in a GCM • Disadvantage: Lack of proper understanding, ad hoc selection of predictors, overestimation of the effect of SST • Examples of studies Gray, 1979 Met. over the Tropical oceans, RMetSoc Royer et al. 1998, Clim. Change Chauvin et al. 2006, Clim. Dyn. MPI for Meteorology Hamburg
Objectives of the present studyHurricane type vortices (HTV) in ECHAM5 . How do the HTVs respond to anthropogenic climate change and how does this depend on resolution? What changes occur in intensity, life time and power dissipation index? What possible mechanisms control the change in HTV? What are the dominant factors? MPI for Meteorology Hamburg
Tracking methods and vortex identification • Tracks are followed from its generation (6x10⁻⁶s-1) until it disappears as an extra-tropical cyclones north of 60N • We calculate the total life-time of the HTVs • We are able to identify the transition from a tropical to an extra-tropical vortex • Alternatively we use the wind speed at 925 hPa as a selection criteria for intense storms • We have also calculated the potential dissipation index, PDI. See Emanuel, Nature, 2005 MPI for Meteorology Hamburg
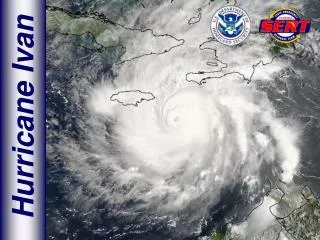
Hurricane Katrina August 2005ECMWF operational analyses, 850 hPa vorticity MPI for Meteorology Hamburg
Katrina vorticity at different levels MPI for Meteorology Hamburg
Katrina850 hPa vorticity at different resolution MPI for Meteorology Hamburg
KatrinaWind speed max. and surface pressure min. MPI for Meteorology Hamburg
Selection of HTV indicators • We use criteria for minimum vorticity at 850 hPa (V), minimum vertical vorticity gradient (G) between 850 and 250 hPa, and number of time steps of 6 hrs (T) when these conditions are fulfilled. • (V, G, T) = (6, 6, 4) vorticity at 850 hPa = 6x10⁻⁵s-1 vorticity 850- 250 hPa = 6x10⁻⁵s-1 conditions fulfilled at least 24 hrs (6, 6, 4) is defined as an HTV MPI for Meteorology Hamburg
All Tropical Storms Hurricanes, Typhoons, Cyclones >33ms-1 (6, 6, 4) (10, 6, 4) (12, 6, 4) 2003 75 33 71 48 39 2004 72 36 79 52 41 2005 80 38 83 62 48 Selection of criteria for selecting hurricane type vortices (HTV) MPI for Meteorology Hamburg
Objectives of the present studyHurricane type vortices (HTV) in ECHAM5 • We have used scenario A1B and studied the periods 1861-1890, 1961-1990 and 2071-2100 • We have explored the coupled T63 run (3 runs) for all periods and • T213 time - slice 1961-1990 and 2071-2100 • T319 time - slice 1971-1990, (2081-2100 to be done) • We have also used AMIP2 runs (20 years) with T63 and T159 as a validation study MPI for Meteorology Hamburg
Comparison with observations from the Tropical Warning Centers and with ERA-40 re-analyses MPI for Meteorology Hamburg
Super Typhoon 21 (1991) in ERA-40 (left)and selected similar storm in ECHAM5 (right)Intensity (vorticity at 850 hPa) MPI for Meteorology Hamburg
Lifetime of HTVs in days MPI for Meteorology Hamburg
Hurricane genesis (a) observed, (b) ERA-40 and (c ) ECHAM5 T159 MPI for Meteorology Hamburg
Hurricane track density(a) observed, (b) ERA-40 and (c ) ECHAM5 T159 MPI for Meteorology Hamburg
Hurricane track density (Atlantic)(d) observed, (e) ERA-40 and (f ) ECHAM5 T159 MPI for Meteorology Hamburg
All (6, 6, 4) >18ms-1 >33ms-1 >2x10⁻⁴ >50ms-1 >5x10⁻⁴ >1x10⁻³ ECHAM5 T159 2073 1848 599 24 ECHAM5 T159 2017 731 72 ERA40 1747 1557 40 0 ERA40 1447 297 1 JRA25 1306 933 7 0 JRA25 1234 323 2 Observed 1236 724 346 Hurricane type vortices (21 years)ECHAM, ERA-40, JRA 25 and Observed MPI for Meteorology Hamburg
ECHAM 5 max. wind speed in different regions MPI for Meteorology Hamburg
ERA-40 max. wind speed in different regions MPI for Meteorology Hamburg
“Observed” max. wind speed in different regions MPI for Meteorology Hamburg
Annual variability of HTVsObserved, ERA-40 and ECHAM5- T159 MPI for Meteorology Hamburg
Interannual variability of HTVs > 33ms-1Observed, ERA-40 and ECHAM5- T159 MPI for Meteorology Hamburg
Active Atlantic years - non active years (left)Active West-Pacific years - less active (right)From above: SST, 850 hPa Vel. Pot., windshear 250-850 pPa MPI for Meteorology Hamburg
Courtesy J. O’Brien MPI for Meteorology Hamburg
The same ERA-40 responseActive Atlantic (left), Active West Pacific (right) MPI for Meteorology Hamburg
Are there observational evidence that hurricanes are becoming more intense? Why is it so difficult? • Longer term records are needed due to internal variability • There have been large changes in the observing systems making it easier to detect more tropical cyclones in later years. • Recent papers have used PDI ( time integral of max. wind cube) which is overly sensitive to observational accuracy • Model studies (e.g. Knutson and Tuleya, 2004) indicate small changes in intensity as of now which are hardly detectable MPI for Meteorology Hamburg
Are there observational evidence that hurricanes are becoming more intense? • YES • Webster et al. (2005), Science, Emanuel (2005), Nature, Sriver and Huber (2006), GRL • NO • Chan (2006), Science, Klotzbach ( 2006), GRL, Landsea et al. (2006), Science MPI for Meteorology Hamburg
There are recent claims that there is an increase in hurricane intensity ( e.g. Emanuel (2005), Webster et al. (2005) • Are these findings credible? • They are generally not supported by operational meteorologists • According to Knutson and Tuleya (2004) any changes are probably undetectable “for decades to come” • Results from this study and some additional work may presumably reduce the likelihood of detection further • There are structural problems in the detection of trends • Changes in observing systems • Difficulties to separate a genuine change in storms from societal causes behind the huge increase in damages and damage cost MPI for Meteorology Hamburg
What may happen in a warmer climate? We have used the AIB scenario And the coupled MPI model at T63 resolution used in the IPCC 4th assessment Higher resolution experiments use the transient SST from T63 (time - window) We study C20 (1961- 1990) C21 ( 2071-2100) MPI for Meteorology Hamburg
What is A1B? • Middle of the line scenario • Carbon emission peaking in the 2050s (16 Gt/year) • CO2 reaching 450 ppm. in 2030 • CO2 reaching 700 ppm. in 2100 • SO2 peaking in 2020 then coming done to 20% thereof in 2100 MPI for Meteorology Hamburg
SST difference (C 21-C 20) MPI for Meteorology Hamburg
HTVs at T63 resolution C19 (black), C20 (red) and C21(blue) MPI for Meteorology Hamburg
T63 T63 All (6, 6, 4) >18ms-1 >2x10⁻⁴ s-1 >33ms-1 >5x10⁻⁴ s-1 >50ms-1 >1x10⁻³ s-1 20C (1961-1990) 20C (1961-1990) 35 34 5.5 6.1 0 0.1 0 21C (2071-2100) 21C (2071-2100) 27 26 5.6 6.4 0.1 0 0 Number of HTVs (T63) for C 20 and C21 for wind speed and vorticity MPI for Meteorology Hamburg
Hurricane genesis T63From top C21-C20, C21 and C20 MPI for Meteorology Hamburg
Hurricane track density T63From top C21-C20, C21 and C20 MPI for Meteorology Hamburg
Changes of HTVs in four hurricane regions (T63) MPI for Meteorology Hamburg
T213 T213 All (6, 6, 4) >18ms-1 >2x10⁻⁴ s-1 >33ms-1 >5x10⁻⁴ s-1 >50ms-1 >1x10⁻³ s-1 20C (1961-1990) 20C (1961-1990) 104 100 97 33 40 3.7 6.0 21C (2071-2100) 21C (2071-2100) 94 92 90 36 4.9 49 9.8 Number of HTVs/year (T213) for C 20 and C21 for wind speed and vorticity MPI for Meteorology Hamburg
Hurricane genesis T213From top C21-C20, C21 and C20 MPI for Meteorology Hamburg
Hurricane track density, T213From top C21-C20, C21 and C20 MPI for Meteorology Hamburg
Changes of HTVs in four hurricane regions (T213) MPI for Meteorology Hamburg