Download
1 / 28
280 likes | 416 Views
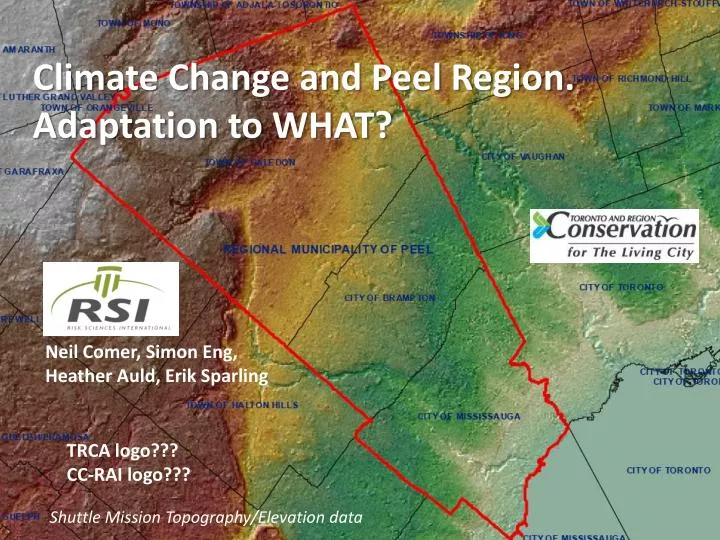
Climate Change and Peel Region. Adaptation to WHAT?. Neil Comer, Simon Eng, Heather Auld, Erik Sparling. TRCA logo??? CC-RAI logo???. Shuttle Mission Topography/Elevation data. Weather : Conditions today and over the next few days; “ operate day-to-day based on weather ”

E N D
Climate Change and Peel Region. Adaptation to WHAT? Neil Comer, Simon Eng, Heather Auld, Erik Sparling TRCA logo??? CC-RAI logo??? Shuttle Mission Topography/Elevation data
Weather: Conditions today and over the next few days; “operate day-to-day based on weather” Climate: Weather over time: Its Extremes, Trends, Changes; “plan on longer term based on climate” Climate consists of: • Average weather – now with new averages and trends January 12, 2013: High of 14.8C broke records from 1938-2012 • Celebrity high impact storms, the “unusual”
Peel Region Climate and Weather Events October 29, 2012: Remnants of Hurricane Sandy… “In Mississauga, 2,000 customers reported being without power.” March 22, 2012: Toronto Pearson high temperature reaches 26.0 C; warmest March on record for many stations (Toronto Pearson & City) July 21, 2011: Toronto Pearson Humidex exceeds 48; extreme at 50.3 in July, 1995 Winter 2009-2010: warmest in Canada since nationwide records began in 1948 - 4.0°C above normal; Lake Ontario temperatures peak at 24C
Peel Region Climate and Weather Events October 29, 2012: Remnants of Hurricane Sandy… “In Mississauga, 2,000 customers reported being without power.” March 22, 2012: Toronto Pearson high temperature reaches 26.0 C; warmest March on record for many stations (Toronto Pearson & City) Winter 2009-2010: warmest in Canada since nationwide records began in 1948 - 4.0°C above normal; Lake Ontario temperatures peak at 24C August 4, 2009: One hour rainfall from a Mississauga gauge exceeded 1 in 100 year event; flooding damages private properties, municipal and Peel Region infrastructure Tornadoes in Peel Region: June 10 1979 & May 31, 1980, Brampton; July 7, 1985 Meadowvale; June 1923, Hornby to Long Branch; etc.
Peel Region Climate and Weather Events 2009: tornado outbreaks; > 18 tornadoes; Vaughan tornado > $10M in damages; largest single-day tornado outbreak in Canadian history 2007: Toronto Pearson experienced driest summer in nearly 50 years with 95 consecutive days without significant rainfall. Lake Ontario water levels down 0.25 metre from long-term average 2005: southern Ontario tornado outbreak Kitchener-Oshawa; Finch Ave washout; ~100mm/hour; highest insured loss in Ontario’s history Winter, 2007-08: Pearson snow total 194 cm; 13 cm shy of record… Summer 2008: wettest June, July and August on record (396 mm).
Peel Region Climate and Weather Events Climate variability and extremes… 2005: southern Ontario tornado outbreak Kitchener-Oshawa; Finch Ave washout; ~100mm/hour; highest insured loss in Ontario’s history Winter, 2001: 104 day stretch with snow on the ground; longest snowcover period in record (dating to 1840) Summer, 2001: Driest summer in 54 years of records (Pearson) May 12, 2000: Severe t-storms; “extensive damage” Port Credit Yacht Club, power outages Brampton and Mississauga January, 1999: Snowiest two-week period since 1846 Tornadoes in Peel Region: June 10 1979 & May 31, 1980, Brampton; July 7, 1985 Meadowvale; June 1923, Hornby to Long Branch; etc.
Toronto’s Climate has been changing in many ways… YYZ Annual Mean Temperatures (Normals) 8.8 1961-1990 7.3 C 1971-2000 7.7 C 1981-2010 8.8 C 7.7 7.3 Updated Climate Normals (Averages) indicate that Toronto Pearson Airport has warmed significantly …
Why the concern over weather, climate and its changes? U.S. study: >75%of natural disasters are triggered directly or indirectly by weather and climate Need to protect critical municipal assets & services – water, transportation, telecomm, buildings and shelters, electricity, energy
Weather Hazards from the “Top 10” List: HIRA’s web-based and survey (226 municipalities) flood heat cold fog hail ice storm wind lightning/ thunderstorm tornado drought hurricane blizzard/snowstorm 41% of Ontario municipalities named power failures in their top 10 hazards 63% municipalities in this region named power failure in the top 10 hazards
Risks to Various Infrastructure Types from Increasing Climate/Weather Extremes (Frequencies/Intensities)
Flexible adaptation options: Work with Infrastructure Lifecycles
Confirmed and Probable Tornadoes by Fujita Scale – Revised and Updated Database (to 2009)
Southern Peel Region Temperature Trends Average Highs Daily Averages Average Lows
Many implications for a changing climate…. Requiring adaptation
Climate Change and Peel Region. Adaptation to WHAT? Neil Comer, Simon Eng, Heather Auld, Erik Sparling Shuttle Mission Topography/Elevation data
Environment Canada Stations Data Length
EC Intensity-Duration-Frequency Stations in the Area (extreme rainfall)
Environment Canada Lightning Detection Network (Proxy for extreme events?)
EC – Long Term Historical Climate Indices - Other climate indices have also been calculated using this dataset Temperature Stations Precipitation Stations
Wave and Wind Statistics • Also ice coverage, freezeup/breakup (erosion protection) • Also 2 buoys in western Lake Ontario (seasonal) (45139, 45159)
Historical Wind Frequency and Strength – Pearson A, Toronto Island A
For projections… • There have been a few local projects already: • 1.PRECIS – U Regina report for MOE • 2.Statistical downscaling (95 locations) for MOE • 3.WRF Regional Climate Model – (U of T) for MOE • 4.SENES Future Weather and climate driver Report for City of Toronto Global models: 24 models in the last assessment (2007), but in the new assessment (2013) there are about 40 models available from which we can calculate an ensemble Additional variables/indices can be calculated from model output (next slide)
27 PROJECTED Climate Change Core Indices (useful for this study?) : 1. FD, Number of frost days: Annual count of days when TN (daily minimum temperature) < 0oC 2. SU, Number of summer days: Annual count of days when TX (daily maximum temperature) > 25oC. 3. ID, Number of icing days: Annual count of days when TX (daily maximum temperature) < 0oC. 4. TR, Number of tropical nights: Annual count of days when TN (daily minimum temperature) > 20oC. 5. GSL, Growing season length: Annual (1st Jan to 31st Dec in Northern Hemisphere count between first span of at least 6 days with daily mean temperature TG>5oC and first span after July 1st of 6 days with TG<5oC. 6. TXx, Monthly maximum value of daily maximum temperature: 7. TNx, Monthly maximum value of daily minimum temperature: 8. TXn, Monthly minimum value of daily maximum temperature: 9. TNn, Monthly minimum value of daily minimum temperature: 10. TN10p, Percentage of days when TN < 10th percentile: 11. TX10p, Percentage of days when TX < 10th percentile: 12. TN90p, Percentage of days when TN > 90th percentile: 13. TX90p, Percentage of days when TX > 90th percentile: 14. WSDI, Warm spell duration index: Annual count of days with at least 6 consecutive days when TX > 90th percentile
15. CSDI, Cold spell duration index: Annual count of days with at least 6 consecutive days when TN < 10th percentile 16. DTR, Daily temperature range: Monthly mean difference between TX and TN 17. Rx1day, Monthly maximum 1-day precipitation: 18. Rx5day, Monthly maximum consecutive 5-day precipitation: 19. SDII Simple precipitation intensity index: the daily precipitation amount on wet days, (RR ≥ 1mm), divided by number of wet days. 20. R10mm Annual count of days when PRCP≥ 10mm 21. R20mm Annual count of days when PRCP≥ 20mm: 22. User defined PRCP threshold. 23. CDD. Maximum length of dry spell, maximum number of consecutive days with RR < 1mm 24. CWD. Maximum length of wet spell, maximum number of consecutive days with RR ≥ 1mm 25. R95pTOT. Annual total PRCP when RR > 95p. 26. R99pTOT. Annual total PRCP when RR > 99p. 27. PRCPTOT. Annual total precipitation
Example of Canadian Regional Model output variables (CANRCM4) from Env. Canada


![Facing the Impacts of Climate Change: Indian SMEs and Adaptation Training Programme [Date] [Time]](https://cdn3.slideserve.com/6765596/slide1-dt.jpg)