Download
1 / 12
120 likes | 127 Views
Gridded population databases: The demand side view. Major usages Both descriptive and analytic Main areas Environment & Biodiversity Climate Hazards & Emergency management Land use change Agriculture Health Urban studies Economic development. The demand side view (continued).

E N D
Gridded population databases: The demand side view • Major usages • Both descriptive and analytic • Main areas • Environment & Biodiversity • Climate • Hazards & Emergency management • Land use change • Agriculture • Health • Urban studies • Economic development
The demand side view (continued) • Minor usages • Ready-to-go denominator • Example: used in Environmental Sustainability Indicator Project to adjust So2 emissions by populated land area rather than total land area (World Economic Forum, 2000) • Proxy variable • Example: for climatic center of population distribution in a study of labor economics (Hall and Jones, 1998)
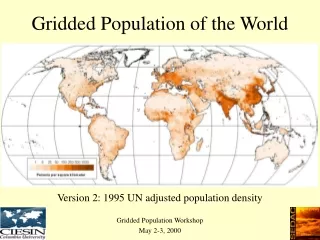
Cohen and Small World population generally “localized” along low-lying coasts, rivers Population peak at 2300 m altitude: Mexican Plateau Data used: GPW Better description about the distribution of human population
UNDP & WRI Population distribution (red) by aridity zone (browns) Shows highest density populations living in predominantly semi-arid or dry sub-humid climates Data: GPW Better description about the distribution of human population (continued)
WRI Close-up of SE Asia Global estimates nearly all areas with 100 km of coast are modified by human activity 20% highly altered by conversion to agriculture or urbanization Data: Night-time lights (OLS) Least modified Cropland and built up area Cropland/natural vegetation mosaic Ecosystem stress:Human modification of coastal areas
WRI Estimate ~2.3 billion people are living in conditions of water stress or water scarcity Allows for estimates by river basin not by national aggregates Many more than had been previously estimated Combines pop data with river basin model run-off data Data: GPW Ecosystem stress (2):Water Availability by River Basin
Project human and tsetse fly population distribution to 2040 Human population growth causes loss of fly habitat Model human-fly interactions based on species-specific behavior Estimate that by 2040 the fly population will decline throughout Africa but an area as large as Europe will remain infested Pop growth affects subspecies differently Robin Reid et al., International Livestock Research Institute, Nairobi Combine human pop data with fly pop data previous efforts failed because national level data do not match that of fly habitat Data: GPW Health (1):Pop growth and the extinction of the tsetse fly
Snow et al. Estimate morbidity and mortality in Africa 1 million deaths in 1995 estimated due to malaria 200 million clinical events Combine gridded population density with national-level data on age structure and malarial data (endemicity, hospital records) Data: GPW Gallup and Sachs Deterministic analysis of malaria and economic growth Population density within 100 km a coastline--to proxy for access to transportation--is dependent variable Despite the strong correlation between poverty and malaria, and the strong impacts of malaria on the economy, the causal mechanism are unclear Data: GPW Health (2):Studies of Malaria
Dobson and colleagues Shows short term (1-2 years) population movement in Kosovo All systematic record keeping suspended Combines heuristic model (for pop data) with media accounts of wartime movement Data: Landscan Migration:Studies of displacement of persons
What’s missing from known studies? • Examples from: • Climate • Land use change • Urbanization • Agriculture • Hazards • Economic development
Scale issues: Small vs. large areas • It seems that topics--and even disciplines--tend to have scale preferences: • Health studies tend to be local, at best continental • Urban studies tend to be local or regional • Climate studies tend to be global • To what extent is this constraint data-driven rather than theory-driven? • Can we create a collection of best-available data sets that can always be aggregated for coarser-scale analysis? • To what extent are methods or inputs scale-specific?
Where have we come in 6 years? • Lots of use • UNEP/GRID-Environment Canada data base has had over 75,000 data transfers since 1996 • Dozens of published papers and books have used gridded population data • almost all note that the study is improved or innovate in part because of the recent availability of population data on a grid • Inputs are getting better • Input data--both for population and administrative boundaries--continue to improve • Satellite data are becoming more useful for integration with population data • Methods are more sophisticated • Applications are becoming more apparent • Need for (and value of) interdisciplinary studies is increasingly recognized