Download
1 / 18
180 likes | 330 Views
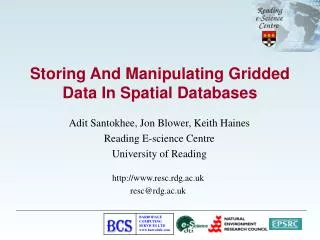
Storing And Manipulating Gridded Data In Spatial Databases. Adit Santokhee, Jon Blower, Keith Haines Reading E-science Centre University of Reading. http://www.resc.rdg.ac.uk resc@rdg.ac.uk. Outline. Background Web service based system : GADS Database System : The Grid DataBlade

E N D
Storing And Manipulating Gridded Data In Spatial Databases Adit Santokhee, Jon Blower, Keith Haines Reading E-science Centre University of Reading http://www.resc.rdg.ac.uk resc@rdg.ac.uk
Outline • Background • Web service based system : GADS • Database System : The Grid DataBlade • Tests Results • Conclusions • Future Work
Background • At Reading we hold copies of various datasets (~2TB) • Mainly from models of oceans and atmosphere • Also some observational data (e.g. satellite data) • From Met Office, SOC, ECMWF, more • Most of these datasets are in the form of files • Datasets are in a variety of formats (e.g. NetCDF, GRIB, HDF5) • Large 4D spatio-temporal grids • Contain data about many variables (e.g. temperature, salinity etc) • Data are discretised on a number of different grids (e.g. standard lat-lon grids of different resolutions, rotated grids)
Background (2) • Hence development of GADS (Grid Access Data Service) • Developed as part of GODIVA project (Grid for Ocean Diagnostics, Interactive Visualisation and Analysis NERC e-Science pilot project) • Originally developed by Woolf et al (2003) • Database systems now include capability for storing geospatial data • ReSC has been evaluating the Informix with Grid DataBlade solution • Investigating whether data can be managed and served more efficiently by being stored in DB
GADS • User’s don’t need to know anything about storage details • Can expose data with conventional names without changing data files • Users can choose their preferred data format, irrespective of how data are stored • Behaves as aggregation server • Delivers single file, even if original data spanned several files • Deployed as a Web Service • Can be called from any platform/language • Can be called programmatically (easily incorporated into larger systems), workflows • Java / Apache Axis / Tomcat
GODIVA Web Portal • Allows users to interactively select data for download using a GUI • Users can create movies on the fly • cf. Live Access Server
The Grid DataBlade • Written, supplied and supported by Barrodale computing services ltd, Victoria, Canada • Plug-in for the IBM Informix database • Stores gridded data and metadata in an object-relational DBMS • Stores grids using a tiling scheme in conjunction with Smart BLOBS • Provides functions to load data directly from GIEF (Grid Import Export Format) file format • Metadata is automatically read from the GIEF file • Plays a key role in the mapping between the real-world coordinates and the location of the data on the hard disk • Provides functions to extract data from the grids • Extractions can be sliced, subsetted or at oblique angles to the original axes
Main features of the Grid DataBlade • Can store: • 1D: timeseries, vectors • 2D: raster images, arrays • 3D: spatial volumes, images at different times • 4D: volumes at different times • 5D: 4D grids with a set of variables at each 4D point • Provides interpolation options using N-Linear, nearest-neighbour or user-supplied interpolation schemes • Provides C, Java and SQL APIs
Example use of Grid DataBlade • extract data along a path e.g. along a ship track that involves many “legs”. The DataBlade automatically does interpolation along the path. Using North Atlantic FOAM Data
Testing Methodology • A key criterion for evaluating GADS and the Grid DataBlade is the time required to extract a certain volume of data from an archive and re-package it as a new file, ready for download • We performed test extractions of data from the UK Met Office operational North Atlantic marine forecast dataset, which has a total size of 100 GB • The data are stored under GADS as a set of NetCDF files and another copy is held in the Informix database • There is one NetCDF file per time step, i.e. one per model day, in GADS • Data ordering is (time, depth, latitude, longitude) • We tested many parameters that control the data extraction time, including: • size of the extracted data • number of source files used in the extraction • shape of the extracted data volume
Preliminary tests results Shape of extracted data : 50 * increasing depth * 50 * 50 DataBlade is faster than GADS for small data extraction GADS : 50 FILES DataBlade :Single SBLOB
Preliminary tests results GADS : 50 FILES DataBlade :Single SBLOB Shape of extracted data : 50 * increasing depth * 200 * 200 DataBlade’s performance declines around 40 MB point
Preliminary tests results GADS : Max 360 FILES DataBlade : Max 12 SBLOBs (1 blob = 30 Files) Shape of extracted data : fixed depth level but different lat-lon space DataBlade’s performance declines around 40 MB point (120 files)
Preliminary tests results Shape for single BLOB extract: time * 1 * 128 * 200 Shape for 10 BLOBS extract : 10 * 1 * 128 * 200 (per BLOB)
Preliminary tests results Shape for single File extract :1*depth*400 *400 Shape for 100 Files extract :100*1*lat*lon
Preliminary tests results Shape for 360 Files : 360 * 1 * lat * lon Shape for 30 Files : 30 *10 * lat * lon
Conclusions • We found that in general, for extracted data volumes below 10MB, the database outperformed GADS • Above this size, GADS was generally found to be capable of the fastest extractions • The performance of the DataBlade decreased dramatically when attempting to extract more than 100MB of data in a single query • With DataBlade, extracting large amounts of data from a single blob is also faster than extracting similar sized data from multiple blobs but the difference is small for small areas • The Grid DataBlade is optimised to support its entire feature set; in particular, it is optimised to retrieve relatively small (a few tens of megabytes) of data rapidly in the case where multiple users are querying the database simultaneously
Future Work • The DataBlade does not support spherical rotations of the latitude-longitude geographic coordinate system (i.e., shifts of poles). • A lot of the model data we are dealing with are actually stored as rotated grids with the North Pole shifted, and so cannot be handled by the current version of the Grid DataBlade. • There is currently no way to fetch portions of a grid based on its contents • for example, “in what locations did the temperature exceed 25 Celsius during the summer of 2003?” • It is also not currently possible to create virtual datasets • for example, the database could in theory calculate density, using temperature and salinity data that have been stored in the database. • Evaluation of Grid DataBlade for PostgreSQL DBMS