Download
1 / 57
580 likes | 808 Views
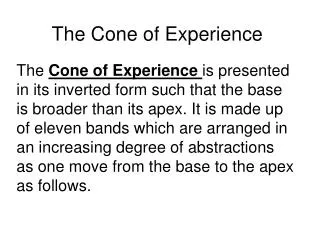
Teaching with Visual Symbols (drawings,cartoons,strip drawings, diagrams, charts, graphs, and maps). “Visual symbols will be made meaningful if we can use them as summaries of our own direct experiences of our rich indirect experiences…. A little can Stand for a lot!”.

E N D
Teaching withVisual Symbols(drawings,cartoons,strip drawings, diagrams, charts, graphs, and maps)
“Visual symbols will be made meaningful if we can use them as summaries of our own direct experiences of our rich indirect experiences…. A little can Stand for a lot!”
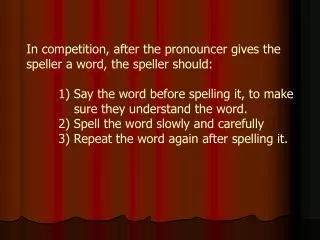
Base on your experience which was easier to understand.The word or the map?
Drawings One essential skill that a teacher ought to possess in order to be understood is Drawing. It helps you a lot if you are capable of doing simple freehand sketching.
Cartoons Another useful visual symbol that can bring novelty to our teaching is the cartoon. A first-rate cartoon tells its story metaphorically. The perfect cartoon needs no caption.
Sources of Cartoons You can easily collect cartoons for instruction. They appear often in newspapers and magazines.
Strip Drawings This are commonly called comics or comics strip. Dale (1969) asserts that a more accurate term is strip drawings. Make use strips that are Educational and Entertaining at the same time.
Sources of Strip drawing You can obtain strip drawings from newspapers, magazines and books.
Diagrams It is “any line drawing that shows arrangement and relations as of parts to the whole, relative values, origins and development, chronological fluctuations, distribution, etc.”
HEREDITY – ENVIRONMENT INTERACTION Intelligence Conclusion s About Heredity – Environment Interaction Heredity – Environment correlations Shared and Nonshared Experiences
Affinity Diagram-use to cluster complex apparently unrelated data into natural and meaningful groups. Types of Diagram
Tree diagram Use to chart out, in increasing detail, the various tasks that must be accomplished to complete a project or achieve a specific objective.
Revise Supervisory program Improve the work Republish all Admin. Teachers offices Improve & ensure opportunity for advancement To create a work environment where 80-90% of Employees are motivated Improve system of rewards & recognition Improve salary & benefits Improve Interpersonal Environment
Fishbone diagram It is also called cause-and-effect diagram. It is a structured form of brainstorming that graphically shows the relationship of possible causes and sub causes directly related to an identified effect/problem.
Charts A chart is a diagrammatic representation of relationships among individuals with an organization. We have a: 1.Time chart 2.Tree or stream chart 3. Flow chart 4. Organizational chart 5. Comparison and contrast chart 6. Pareto chart 7. Run chart or trend chart
Time Chart Is a tabular time chart that presents data in ordinal sequence
Time Period Average Life Prehistoric Times • Ancient Greece • Middle Ages, England • 1620, Massachusetts Bay • Colony • 19th century, England • 1990, USA • 1915, USA • 1964, USA • 1988, USA Expectancy (in years) 18 20 33 35 41 47 54 70 77c
Tree or Stream chart Depicts development, growth and change by beginning with the course(the trunk)which spreads out into many branches; or by beginning with many tributaries which then converge into a single channel.
Flow Chart Is a visual way of charting or showing a process from beginning to end. It is a means of analyzing a process. By outlining every step in a process, you can begin to find inefficiencies or problems.
Organizational Chart • Shows how one part of the organization relates to other parts of the organization.
Pareto chart Is a type of bar chart, prioritized in descending order of magnitude or importance from left to right. It shows at a glance which factor are occurring most.
Gannt chart Is an activity time chart.
Graphs There are several types of graphs. They are: • Circle or pie graph • Bar graph • Pictorial graph • Line graph
Bar graph-use in comparing the magnitude of similar items at different ties or seeing relative sizes of the parts of a whole.
Graphic organizers • You met several graphic organizers in your subjects, Principles of Teaching.
Name :_______________________________________ Topic: Questions:_____________________________________________________________________________________________________________________________________________ Main idea: How to use it: Summary:____________________________________________________________________________________________________________________________________
Place Duration Time Episode Effect Cause Person Person Person
Reforestation Forest fire Shortage of tree that producing oxygen Global Warming Smoke
K – W – L Chart K (What I Know) W (What I Want to learn) L (What I learned)
Maps is a “representation of the surface of the earth or some part of it..”