Download
1 / 57
570 likes | 678 Views
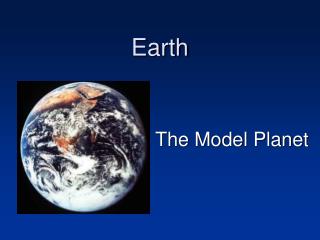
State of the Planet “Executive Summary”. James G. Harris Professor, EE Department and CPE Program EE 563 Graduate Seminar October 22, 2004. “The Blue Marble” Apollo 17 photograph (NASA). Outline. Background Overview of State of the Planet Summary of each of the eight papers Conclusions

E N D
State of the Planet“Executive Summary” James G. Harris Professor, EE Department and CPE Program EE 563 Graduate Seminar October 22, 2004
Outline • Background • Overview of State of the Planet • Summary of each of the eight papers • Conclusions • Reference websites
Background – Special Series • Special report commissioned by Science to assess state of planet now, and to give an estimate for 2050 • Two articles per issue for four consecutive weeks 14 Nov. – 5 Dec. 2003 • Followed in 12 Dec. 2003 with special issue on the publishing in Science of “Tragedy of the Commons” by Garret Hardin 35 years ago • This presentation is a brief summary of the eight articles
Background – The Eight Papers • “Human Population: The Next Half Century” by Joel E. Cohen • “Prospects for Biodiversity” by Martin Jenkins • “Tropical Soils and Food Security” by Michael Stocking • “The Future for Fisheries” by Daniel Pauly et al
Background – The Eight Papers • “Global Freshwater Resources: Soft-Path Solutions for the 21st Century” by Peter Gleick • “Energy Resources and Global Development” by Raymond J. Chow et al • “Global Air Quality and Pollution” Hajime Akimoto • “Modern Global Climate Change” by Thomas R. Karl and Kevin E. Trenberth
Overview of SOTP • Eight areas represent the state of the planet • Five common resources: • Air • Fresh Water • Fisheries • Food and Soil • Energy • Three key trends: • Human population • Biodiversity • Climate
Overview of SOTP • Personal observations • Helps establish a defining set of variables for a very complex system using scientific perspective • Engineering via computers, observation systems (space and senor electronics), and communications make SOTP possible • Span of consideration 2000-2050 covers the expected span of your careers
“Human Population: The Next Half Century” • Earth’s population grew from 600 M in 1700 to 6.3 B in 2003 • Order of magnitude growth in 300 years • 1965-70 global population growth rate reached its all-time high of 2.1% per year • 1.2% in 2002 • Demographics predictions for 2050 based upon two UN sources: • UN Population Division’s urbanization forecasts • World Population Prospects: The 2002 Revision
“Human Population: The Next Half Century” • UN alternative projections include: low, median, high, and constant-fertility variants • Analysis based upon median variant • Growth from 6.3B to 8.9B in 2050 • Comparison with historical growth rate: • Beginning to 1800 for 1B growth in population • 13-14 years from now 1B growth
“Human Population: The Next Half Century” • Demographic uncertainties • Migration and Families • Migration • From less to more developed countries • 2.6M now declining to 2.0M in 2025-30 and remaining constant • Families • Falling fertility • Increasing longevity • Changing mores of marriage, cohabitation, and divorce
“Prospects for Biodiversity” • Consideration for biodiversity: • Tropical forest • Temperate forest • Marine • Freshwater • Assumptions: • UN median population estimates for 2050: 6B to 9B by 2050 • Intergovernmental Panel on Climate Change scenario: average surface temperature increases ~1-2º C and CO2 increases ~100-200 ppm • Humanity conducts affairs as a whole as currently
“Prospects for Biodiversity” • Considerable number of species extinctions will take place • Existing large blocks of tropical forests reduced and fragmented • Temperate, and some tropical, forests will be stable or increasing in area • Marine ecosystems very different with few large marine predators • Freshwater biodiversity will be severely reduced almost everywhere
“Prospects for Biodiversity” • How much does it matter to human existence? • Growing consensus humans directly or indirectly responsible for extinction of all or most of large terrestrial animal species • Case of New Zealand: 38 species of flightless avifauna reduced to 9 with few signs overall of terminal crisis to humans • Some point a threshold may be crossed, but likely consequences from other factors such as abrupt climate shift
“Tropical Soils and Food Security” • UN Food and Agriculture Organization definition of food security: “when all people, at all times, have physical and economic access to sufficient safe and nutritious food to meet their dietary needs and food preferences for an active and healthy life” • Currently,1B people without food security (1 in 6) • 60% of rural communities in tropics and subtropics are persistently affected by decline in household food production
“Tropical Soils and Food Security” • Soil quality defined by Soil Science Society of America: “the capacity of a soil to function within land use and ecosystem boundaries, to sustain biological productivity, maintain environmental quality and promote plant, animal and human health” • Issue is ascribing decline in food production unambiguously to soil quality • Evidence of impact of soil quality on food production growing
“Tropical Soils and Food Security” • Future in managing soil quality rests in working with local communities • Evidence of adaptability, flexibility, and responsiveness to techniques that bring private benefits to smallholders • Providing simple provisions such as adequately resourced extension services and access to technology to smallholders can transform food production
“The Future for Fisheries” • Fisheries commonly perceived as local affairs requiring annual reassessments of species-specific catch quota • Past decade established fisheries components of global enterprise on its way to undermining its supporting ecosystems • Future of fisheries • Identification and extrapolation of fundamental trends • Development and exploration with and without computer simulation of possible futures
“The Future for Fisheries” • Global fisheries landing declined about 500,000 metric ton per year from a peak of 80-85 million tons in the late 1980s • Geographic and depth expansion of fisheries easier to extrapolate • Over past 50 years • Bottom fishing went from 200 m to 1000 m • Oceanic tuna, billfishes and relatives covered the world ocean by the early 1980s
“The Future for Fisheries” • Four future scenarios proposed by UN Environmental Programme • Market first: market considerations shape environmental policy • Security first: conflicts and inequality lead to strong socioeconomic boundaries between rich and pool • Policy first: governments balance social equity and environmental concerns • Sustainability first: value system change favoring environmental sustainability • 20-30% decrease and redistribution of current fishing effort • Scenarios describe what might happen, not what will happen • Tragedy of the Commons
“Global Freshwater Resources:Soft-Path Solutions for the 21st Century” • 20th century water policies relied on massive infrastructure (dams, aqueducts, pipelines, centralized treatment plants) to meet human demands • Hard-Path solution • Serious unresolved water problems remain • 1B people lack safe drinking water • 2.4B people lack access to adequate sanitation services
“Global Freshwater Resources:Soft-Path Solutions for the 21st Century”
“Global Freshwater Resources:Soft-Path Solutions for the 21st Century”
“Global Freshwater Resources:Soft-Path Solutions for the 21st Century”
“Global Freshwater Resources:Soft-Path Solutions for the 21st Century” • Soft-Path approach: • Improve the productivity of water • Delivers water services and quality matched to users’ needs • Applies economic tools with goal to encourage efficient use and equitable distribution • Includes local communities in decisions about water management, allocation, and use • A fallacy of hard-path approach: using less water, or failing to use more water, leads to loss of well-being
“Global Freshwater Resources:Soft-Path Solutions for the 21st Century”
“Global Freshwater Resources:Soft-Path Solutions for the 21st Century” • Transition to soft-path already started • Examples in US: • Last two decades amount of water for toilets declined by 75% • Proposed 67% reduction water use in California urban areas without reduction in service • Agriculture – farmers want to grow food and fiber, not use water: use of drip irrigation • Industry – semiconductor wafer water use went from 30 gal/in2 in 1970 to 6gal/in2 in 2003 • Conclusion: can’t follow both paths, must choose
“Energy Resources and Global Development” ■ Availability of global energy resources and their use
“Energy Resources and Global Development” • Current rate of consumption (year 2000) • Coal: .5% of reserves • Natural gas: 1.6% of reserves • Oil: 3% of reserves • Nuclear: 2% of reserves • World not running out of mineral fuels • But still finite amounts • Possession of reserves not essential for development • Japan: very little energy resources, but highly developed • Nigeria: large oil reserves, but developing status
“Energy Resources and Global Development” • 95% of annual energy consumption from fossil fuels • 44% petroleum • 26% natural gas • 25% coal • 2.5% hydroelectric • 2.4% nuclear • 0.2% nonhydro renewable energy • Higher GNP per capita generally implies higher efficiency of energy use • Cost of renewable energy not competitive at this time
“Energy Resources and Global Development” • Growing concern for fossil fuel emission of greenhouse gasses • Given growing environmental concerns, future use of fossil resources will change: • Processes with increased efficiency • Lower localized air pollution • Carbon capture and sequestration • Electricity generation will remain most important use • Generation flexibility • Flexibility in use
“Energy Resources and Global Development” • Will world make transition to renewables? • Simple answer – yes, when fossil costs rise • Next 25-50 years, little transition expected • If fossil fuel depletion occurs more rapidly • Renewables and alternatives may come online more quickly • Requisite political will and financial support required • Benefits of fossil fuels do not make up for negative effects on environmental health and human welfare
“Global Air Quality and Pollution” • 1986 report using MAPS satellite data established that air pollution was an international issue • Affected regional and global air quality • Industrial fossil fuel burning from developed countries • Biomass burning emissions from developing countries • Recent satellite data confirms: GOME, SCHIAMACHY, MOPITT, TOMS, TERRA • Aerosol distribution also global in extent • Surface ozone increasing
“Global Air Quality and Pollution” • Pollutant atmospheric lifetimes long enough to transport to other continents • Order of 1 week for intercontinental transport • Ozone: 1-2 weeks summer, 1-2 months winter • CO 1-2 months • Aerosols impact climate: 1-2 weeks
“Global Air Quality and Pollution” • Megacities of greater than 10M people are sources of regional and global pollution • In 2001, 17 megacities according to UN • Population growth and urbanization in future • Local, regional, and global air-quality issues should be viewed in integrated manner • Regional and global environmental impacts • Climate change
“Modern Global Climate Change” • Planet Earth habitable because • relative location to sun • Natural greenhouse effect of its atmosphere • Energy flow from sun • Average energy at top of atmosphere 175 PW • ~31% reflected from clouds and surface • 120 PW absorbed by atmosphere, land, or ocean • Ultimately emitted back to space as infrared radiation • Infrequent volcanic eruptions have perturbed flow • Inferred changes in total solar irradiance are small (0.2o C in first half of 20th century; smaller later part)
“Modern Global Climate Change” • Human influences on climate dominate detectable influence for past 50 years • Main impact on changes in atmospheric composition (not actual heat generation) • Estimated 1% change in energy flow to date dominates all other human influences • 1 PW = 1million 1000 MW power stations • Atmospheric composition changes due to anthropogenic emissions of greenhouse gases
“Modern Global Climate Change” • Absence of climate mitigation policies, 1.7o to 4.9o C is 90% probability interval for warming from 1990 to 2100 • More frequent heat waves, droughts, extreme precipitation events • Related regional impacts: wild fires, vegetation changes, sea level rise • Rate of human-induced climate change projected to be faster than natural processes, e.g., 10,000 year cycle ice ages • Irreversible thresholds likely exist • Climate change guaranteed in future
Conclusions • Five common resources: • Air: pollution is global, not local, problem • Fresh Water: efficient use of water, not produce more water • Fisheries: tragedy of the commons problem • Food and Soil: local solutions to efficiently produce food and fiber • Energy: market forces will most likely cause change from fossil fuel dependency • Three key trends: • Human population: ~50% more people by 2050 (6B to 9B) • Biodiversity: less diversity, but impact to human life on the planet less than other factors • Climate: human impact on atmosphere growing in significance with unknown consequences