Download
1 / 58
580 likes | 595 Views
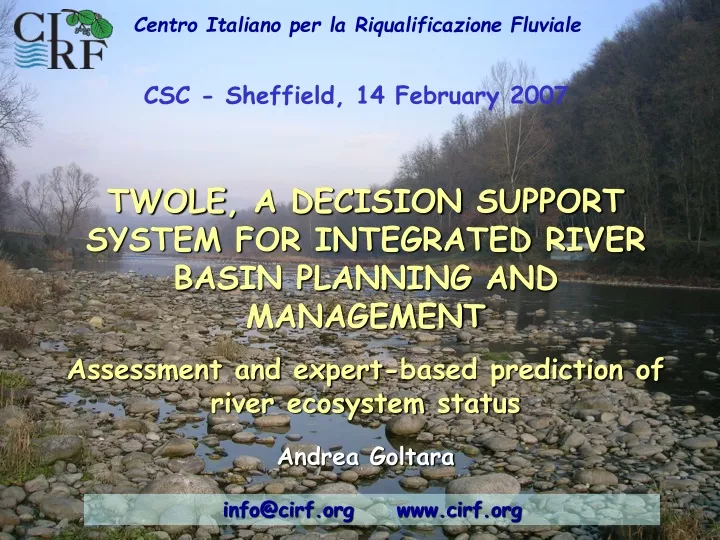
Centro Italiano per la Riqualificazione Fluviale. CSC - Sheffield, 14 February 2007. TWOLE , A DECISION SUPPORT SYSTEM FOR INTEGRATED RIVER BASIN PLANNING AND MANAGEMENT Assessment and expert-based prediction of river ecosystem status. Andrea Goltara. info@cirf.org www.cirf.org.

E N D
Centro Italiano per la Riqualificazione Fluviale CSC - Sheffield, 14 February 2007 TWOLE, A DECISION SUPPORT SYSTEM FOR INTEGRATED RIVER BASIN PLANNING AND MANAGEMENT Assessment and expert-based prediction of river ecosystem status Andrea Goltara info@cirf.org www.cirf.org
WHAT IS CIRF CIRF is a private, independent, technical-scientific and non-profit organisation founded in 1999 to: promote river restoration, foster the diffusion of RR culture and related knowledge, and its application
MAIN ACTIVITIES EDUCATION INFORMATION • Web Site • Publications • Meetings • Training courses • Seminars • Study trips APPLICATION • Pilot Projects • Studies
www.ecrr.org EUROPEAN CENTRE FOR RIVER RESTORATION 2006-2009: CIRF holds the secretariat of the ECRR a network of practitioners of river restoration
4th ECRR RIVER RESTORATION INTERNATIONAL CONFERENCE 16-21 June 2008 San Servolo Island
The TwoLe projects • TwoLe: Two-Level Decision Support System for WR planning and management • Funding: Cariplo Foundation • Duration: 24 months (ongoing) • Partners: • DEI - Politecnico di Milano • DIIAR - Politecnico di Milano • AGR - Istituto di Idraulica Agraria dell’Università degli Studi di Milano • IIEIT - Istituto di Elettronica e di Ingegneria dell’Informazione e delle Telecomunicazioni • CIRF - Centro Italiano di Riqualificazione Fluviale • COTI - Consorzio del Ticino
The TwoLe projects Cluster of three projects: • TwoLe/A: management (application to lake Verbano and Ticino river) • TwoLe/B: planning (application to lake Lario and Adda river) • TwoLe/C: software development and management of public participation (STRaRIPa) www.twole.info
TwoLe OBJECTIVES • Implement and test a MODSS (TwoLe) to support the definition and implementation of participated River Basin Plans according to the WFD • Plans have to be developed according to the IWRM paradigm OBJECTIVE of TwoLe/B: Test TwoLe in planning of lake Lario and Adda river basin OBJECTIVE of TwoLe/A: Test TwoLe in the management of lake Verbano and Ticino river basin
TwoLe-B: taking into account conflicting objectives in planning at the river basin scale Tourism Canoeing Hydropower Flooding risk Fishing Agriculture River Ecosystem
TwoLe-B – CIRF: an index for fluvial ecosystem...and something more The PROBLEM: How to include operationally in a rational, transparent and participatory planning scheme and procedure the objective “improving fluvial ecosystem status” (WFD) ?
TwoLe-B – CIRF: an index for fluvial ecosystem...and something more GENERAL OBJECTIVE: Forecast and assess (ex-ante) the effects of planning alternatives on fluvial ecosystems in order to compare the effects with those on other sectors/actors at stake
TwoLe-B – CIRF: an index for fluvial ecosystem...and something more • SPECIFIC objectives: • set-up an operational scheme and tool (index) to evaluate the current and future status of fluvial ecosystem and to forecast (cause-effect model) the effects of different alternatives • test the suitability of expert-based modelling in contexts of scarce information
STEPS of our METHODOLOGY • CRITERIA to ASSESS the FLUVIAL ECOSYSTEM STATUS (according to WFD): the “VALUE TREE” • The REFERENCE STATUS • MEASURING the CLOSENESS to REFERENCE STATUS: “CLOSENESS INDICATORS” • AGGREGATION of INDICATORS into (sub-)INDICES: the VALUE FUNCTION concept • The CAUSE-EFFECT MODEL • conceptualization of the causal network • Formalization of causal factors • determination of cause-effect relationships
1. Status of fluvial ecosystem (WFD) -> the value tree • WHICH CRITERIA to SELECT the ATTRIBUTES? • Conceptually robust • Coherent with the WFD • Useful discard those that do not change within the Solution Alternatives considered (planning/management) • Assessable today • Predictable as a consequence of possible actions to be implemented (solution Alternatives) • Feasible to assess corresponding REFERENCE conditions • Can be modelled (computation can be performed automatically in the DSS) • Can be represented in an intuitive fashion to non experts
1. Status of fluvial ecosystem -> the value tree: FLEA adapted
1. Status of fluvial ecosystem -> the value tree of TwoLe-B ECOLOGICAL STATUS Physico-chemical quality (water quality) General conditions LIM Biodiversity-winter Biodiversity-spring Biodiversity-summer Biodiversity (EPT) Benthic macroinvertebrates Biodiversity-autumn Abundance Autochthonous species Total exotic species Community composition Exotic species Presence of Silurus Glanis Fish fauna Age distribution structure Population structure (key species) Biological quality (terrestrial and aquatic biota) Naturalness of structural features Abundance Naturalness Autochthony Riparian vegetation Cover Longitudinal continuity Terrestrial flora Width of riparian strip Naturalness (species) Corridor (zonal) vegetation Cover Characteristics of regime (annual, monthly flows; max, min annual flow; peak and period,…) Indicators not represented for lack of space Standard deviations Hydromorphological quality Hydrological regime Mean values
STEPS of our METHODOLOGY • CRITERIA to ASSESS the FLUVIAL ECOSYSTEM STATUS (according to WFD): the “VALUE TREE” • The REFERENCE STATUS • MEASURING the CLOSENESS to REFERENCE STATUS: “CLOSENESS INDICATORS” • AGGREGATION of INDICATORS into (sub-)INDICES : the VALUE FUNCTION concept • The CAUSE-EFFECT MODEL • conceptualization of the causal network • Formalization of causal factors • determination of cause-effect relationships
EVALUATION INDEX FISH FAUNA (f) Community composition (f1) Population structure (key species) (f2) Age distribution structure key species (f21) Abundance key species (f22) Presence of autochthonous species (f11) Presence of exotic species (f12) Exotic species / tot (f121) Presence of silurus (f122) Prevailing hydromorphol. conditions during minimum flow period (same year) Stress hydromorphol. conditions Prevailing hydromorphol. conditions during minimum flow period (last 3 years) Stress hydromorphol. conditions hatching period key species Longitudinal Continuity (l) Causal factors Minimum annual 3-days flow (q) Triennial average of prevailing flow during minimum flow quarter (m) Minimum daily flow during hatching period key species (s) Prevailing flow during minimum flow quarter (Q) Making fish-passages / removing discontinuities Managing flow released from lake and derived/(released) for hydropower/irrigation Actions Cause-effect model 5a. Conceptualization of the causal network: fish fauna
5a. Conceptualization of the causal network Statistical analysis Which are the main variables? ? Experts
Macroinvertebrates (m) Biodiversity of the community (m1) Abundance (of habitat) (m2) Biodiv. winter (m11) Biodiv. spring (m12) Biodiv. summer (m13) Biodiv. autumn (m14) 5a. Conceptualization of the causal network: macroinvertebrates EVALUATION INDEX Stress hydromorphol. conditions Prevailing hydromorphol. conditions Dissolved oxygen previous 3 months (d) Causal factors Minimum flow previous month (q) Median flow previous 3 months (Q) Pollutant loads reduction (scenario) Managing flow released from lake and derived/(released) for hydropower/irrigation Actions Cause-effect model
STEPS of our METHODOLOGY • CRITERIA to ASSESS the FLUVIAL ECOSYSTEM STATUS (according to WFD): the “VALUE TREE” • The REFERENCE STATUS • MEASURING the CLOSENESS to REFERENCE STATUS: “CLOSENESS INDICATORS” • AGGREGATION of INDICATORS into (sub-)INDICES : the VALUE FUNCTION concept • The CAUSE-EFFECT MODEL • conceptualization of the causal network • Formalization of causal factors • determination of cause-effect relationships
Macroinvertebrates (m) Biodiversity of the community (m1) Abundance (of habitat) (m2) Biodiv. winter (m11) Biodiv. spring (m12) Biodiv. summer (m13) Biodiv. autumn (m14) 5b. Formalization of causal factors EVALUATION INDEX Stress hydromorphol. conditions Prevailing hydromorphol. conditions Dissolved oxygen previous 3 months (d) Causal factors Minimum flow previous month (q) Median flow previous 3 months (Q) Pollutant loads reduction (scenario) Managing flow released from lake and derived/(released) for hydropower/irrigation Actions Cause-effect model
5b. Formalization of causal factors Example 1 hydro-morphological conditions corresponding to min daily flow in the preceding month “Stress hydro-morphological conditions” Min (Qt), t[t-30;t]
STEPS of our METHODOLOGY • CRITERIA to ASSESS the FLUVIAL ECOSYSTEM STATUS (according to WFD): the “VALUE TREE” • The REFERENCE STATUS • MEASURING the CLOSENESS to REFERENCE STATUS: “CLOSENESS INDICATORS” • AGGREGATION of INDICATORS into (sub-)INDICES : the VALUE FUNCTION concept • The CAUSE-EFFECT MODEL • conceptualization of the causal network • Formalization of causal factors • determination of cause-effect relationships
Macroinvertebrates (m) Biodiversity of the community (m1) Abundance (of habitat) (m2) Biodiv. winter (m11) Biodiv. spring (m12) Biodiv. summer (m13) Biodiv. autumn (m14) 5c. Determination of cause-effect relationships EVALUATION INDEX ? ? ? ? Stress hydromorphol. conditions Prevailing hydromorphol. conditions Dissolved oxygen previous 3 months (d) ? ? Causal factors Minimum flow previous month (q) Median flow previous 3 months (Q) ? ? ? Pollutant loads reduction (scenario) Managing flow released from lake and derived/(released) for hydropower/irrigation Actions Cause-effect model
5c. Determination of cause-effect relationships TYPES of MODELS to BUILD CAUSE-EFFECT RELATIONSHIPS • Mechanistic (deterministic or stochastic) • Empirical (based on experimental data) : deterministic (multiple regression, neural network, ...) or stochastic (ex. ARX, PARMAX) • Expert-based, based on value judgement of experts, formalized through a multi-attribute VALUE FUNCTION ( deterministic) or a Bayesian Belief Network (BBN) ( stochastic), calibrated through answers of experts to ad hoc questionnaires
5c. Determination of cause-effect relationships EVALUATION INDEX Macroinvertebrates (m) Abundance (of habitat) (m2) Example 1 – empirical, deterministic model based on experimental data ? Median flow previous 3 months (Q) Causal factors Managing flow released from lake and derived/(released) for hydropower/irrigation Actions Cause-effect model
5c. Determination of cause-effect relationships Example 1 – empirical, deterministic model based on experimental data Step 1 – Analysis of satellite images (Landsat TM 7)
5c. Determination of cause-effect relationships Example 1 – empirical, deterministic model based on experimental data Step 2 - Classification and assignment of pixel “water”
5c. Determination of cause-effect relationships Example 1 – empirical, deterministic model based on experimental data Step 3 – Estimation of the relationship “flow rate-wet area”
5c. Determination of cause-effect relationships Example 2 - empirical, statistical model based on experimental data In many cases INSUFFICIENT amount of DATA and/or NOT SUITABLE because of the METHODOLOGY adopted
5c. Determination of cause-effect relationships RENOUNCING to EXPRESS a JUDGEMENT OR TRYING a DIFFERENT APPROACH? ?
5c. Determination of cause-effect relationships Example 3 - models based on expert judgement
Hybrid fario/marmorata 7% Vairone Trota marmorata 93% 5c. Determination of cause-effect relationships: fish fauna Example 3 - models based on expert judgment Depend on available data and on direct experience of experts on the case study considered
5c. Determination of cause-effect relationships: fish fauna EVALUATION INDEX FISH FAUNA (f) Community composition (f1) Example 3 - models based on expert judgment Presence of autochthonous species (f11) Prevailing hydromorphol. conditions during minimum flow period (last 3 years) Longitudinal Continuity (l) Causal factors Triennial average of prevailing flow during minimum flow quarter (m) Making fish-passages / removing discontinuities Managing flow released from lake and derived/(released) for hydropower/irrigation Actions Cause-effect model
5c. Determination of cause-effect relationships: fish fauna Example 3 - models based on expert judgment For a given alternative of longitudinal (dis)continuity...
? ? ? ? ? 5c. Determination of cause-effect relationships: fish fauna Example 3 - models based on expert judgment Qminflow quarter Hydromorphol. conditions (v, h, t...)
5c. Determination of cause-effect relationships: fish fauna Example 3 - models based on expert judgment X X IF 5 < m ≤ 25 →f11 = 6 + (8/20)*(f11-5)*m; IF 25 < m ≤75 →f11= 14 + (5/50)*(f11-25) *m; IF m > 75 → f11 = 19
5c. Determination of cause-effect relationships Example 3 - models based on expert judgment How was the consultation/questionnaire to experts conducted? Example: biodiversity indicators for macroinvertebrates
5c. Determination of cause-effect relationships: macroinvertebrates EVALUATION INDEX Example 3 - models based on expert judgment Macroinvertebrates (m) Biodiversity of the community (m1) Biodiv. winter (m11) Biodiv. spring (m12) Biodiv. summer (m13) Biodiv. autumn (m14) Stress hydromorphol. conditions Prevailing hydromorphol. conditions Dissolved oxygen previous 3 months (d) Causal factors Minimum flow previous month (q) Median flow previous 3 months (Q) Pollutant loads reduction (scenario) Managing flow released from lake and derived/(released) for hydropower/irrigation Actions Cause-effect model
5c. Determination of cause-effect relationships: macroinvertebrates Example 3 - models based on expert judgment How was the consultation/questionnaire to experts conducted? 1. Flow Q hydro-morphological condition (state) For each reach we got several couples [Q, image]
Q=15 m3/s 5c. Determination of cause-effect relationships: macroinvertebrates Example 3 - models based on expert judgment How was the consultation/questionnaire to experts conducted? 2. We showed the experts data of samplings from representative stations and corresponding value of causal factors (for Q: corresponding images)
5c. Determination of cause-effect relationships: macroinvertebrates Example 3 - models based on expert judgment How was the consultation/questionnaire to experts conducted? 3. Definition of the range of variation of the causal factors; Definition of the values min and max of each indicator, in correspondence with the worst and best values assumed by the causal factors in the range N. of EPT taxa Nmax Nmin X Xmin Xbest Xmax
5c. Determination of cause-effect relationships: macroinvertebrates Example 3 - models based on expert judgment How was the consultation/questionnaire to experts conducted? 4. Constructions with the experts of the mono-dimensional “Value Functions” (VF) related to each causal factor
5c. Determination of cause-effect relationships: macroinvertebrates Example 3 - models based on expert judgment How was the consultation/questionnaire to experts conducted? 5. Aggregation of the single VF in a multi-dimensional Value Function, asking the experts about the relative importance of each single causal factor m13= m13,min+D*[lQvQ(Q)+ lqvq(q)+ ldvd(d)] lQ = 0.27 lq = 0.20 ld = 0.53 m13= 1+15*[0.27vQ(Q)+0.20vq(q)+ 0.53vd(d)]
5 9 35 77 100 220 30 29 28 27 26 25 24 23 16 15 14 13 20 19 11 8 4 3 18 17 10 7 2 1 22 21 12 9 6 5 Q d d 4 12 6 dR= 10 8 8 6 10 4 5 35 100 220 Q 9 77 12 QR= 128 5c. Determination of cause-effect relationships: macroinvertebrates Example 3 - models based on expert judgment How was the consultation/questionnaire to experts conducted? 6. Validation of the function obtained, asking the experts to rank situations corresponding to several different combinations of the value assumed by the causal factors a. Indifference Curves b. Ranking
CONCLUSIONS about our CASE STUDY • Coherence of the indicators and indices with WFD: partially satisfied, but definitely not provable • Dramatic gaps in available data, particularly Q! • Low reliability of models (reconstruction of Q in some reach with high uncertainty; lack of images of some reach to represent hydro- morphological situations; models developed for some reach and extended to others) • For a real use (evaluation of management alternatives and negotiation) needs to refine the results based on the same methodology, but after filling the information gaps
PROJECT CONCLUSIONS • When abundant and reliable data is available, the empirical –statistical or mechanistic- approach is more likely to give reliable and convincing results • Nevertheless, the most frequent situation is just that of extreme scarcity of useful data and of impossibility (due to available resources and time, but also due to physical and operational difficulties) to collect necessary data to develop empirical or mechanistic models • One needs to choose whether to give up, for the sake of scientific rigour, to use a rational tool for decision-making, or rather accept a more approximate tool, but conceptually robust
PROJECT CONCLUSIONS • 3. It is sensible to articulate the evaluation INDEX and cause-effect network according to the case at hand • At the extreme, one might proceed in “one shot” by building the final INDEX with no intermediate attributes/indicators. BUT: • i) Lower accomplishment of WFD scheme; • ii) Less representable and understandable by non-experts (stakeholders); • In any case the conceptualization exercise is recommendable not to lose internal understanding and agreement.