Download
1 / 25
250 likes | 371 Views
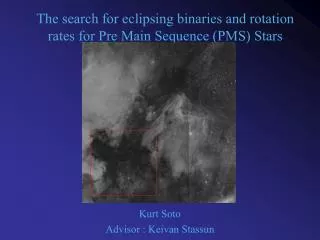
Colour Magnitude diagrams and Pre-Main-Sequence (PMS) populations. Nathan Mayne. PMS detection mechanisms. Class 0, Deeply embedded stars, 15-30K black body. Class I, IR source, still embedded. Class II, Optically visible, IR excess (disc), accretion lines. CTTS. Class III,

E N D
Colour Magnitude diagrams and Pre-Main-Sequence (PMS) populations. Nathan Mayne
PMS detection mechanisms. • Class 0, • Deeply embedded stars, 15-30K black body. • Class I, • IR source, still embedded. • Class II, • Optically visible, IR excess (disc), accretion lines. CTTS. • Class III, • weak line emissions, less IR excess (no-disc). WTTS.
WTTS: No Disc • Thin H-Chromospheric hydrogen (undamped by disc). • BOTH: • Dust & particulates-Reddening of light. • X-rays-Conversion of g(accretion). • Li absorption-Convective, material mixed, (LDB). • Continuum radiation-Accretion hotspots. • CTTS: Disc • NIR & UV excess-Inner disc edge heated. • FIR excess-far disc slower heating. • Broad H-Magnetically driven accretion (high vel red/blue shifted).
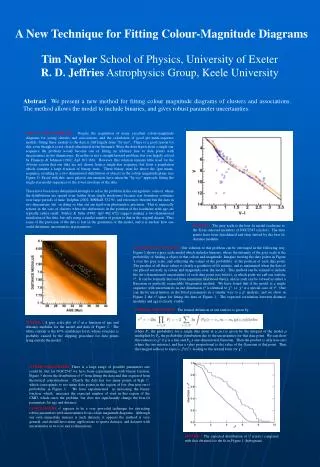
Colour Magnitude Diagrams. Large scale surveys of wide fields. WFC on the INT.
Theory. • Isochrones; • From models of stellar interiors. • Tsurface Mass relations. • Convert SED to magnitudes in different colour bands. • Account for distance dimming, Lbol spread over sphere. • Reddening from ISM. • Use isochrones to estimate Age, distance or reddening/extinction. Given other two quantities. • Theoretical with the above degrees of freedom and degeneracy large error budget. • Difficulty in selecting only members of a cluster/group.
Isolating members of a PMS. • Indirectly; • Isolate the cluster, use CMD for PMS; • Clusters centrally condensed, more massive objects sink/formed in centre. • Cut the catalogue at expected OB/massive star limit. • Plot positions on the sky to find conglomerations. • Assume a circular distribution, cut full catalogue, increasing ratio members to non-members. • Directly; • From T Tauri models. • H • Variablity • X-rays • Li Both include percentage of non-members, BG or FG. Sequence clearer.
Empirical isochrones. Isochrones formed by fitting a line through the sequence.
Empirical isochrones. • Sequence isolation • Photometric cut to clean. • Averaging filter applied to sequence. • Quadratic fitted through averages, for gradient. • Cubic spline fitted through averages. • Median used over Mean • Tied to real star in population • Lessens effect of outliers, many from sequence. • Results in smooth line through each sequence. • Given extinction and distance modulus-combine.
Inconsistencies/Discoveries. • CepOB3b • Age in literature 7 Myrs. • Actually closer to 3Myrs • Often cited as spurious, has H2 material at 7 Myr-SSF. • IC348 • Studied, as many young groups in IR. • Conversion of reddening IR to V,V-I incorrect. • Sequence tighter in V, V-I.
Conclusion. • Reduced huge, concurrent photometric dataset. • Developed a fitting routine to provide empirical isochrones. • Discovered key inconsistencies in current understanding. • Developed relative age ladder. • Increased automation of reduction process.
WYFFOS • Multi-fibre spectrograph. WHT Visit. • Find continuum flux c.f line flux. • In many assoc c.f to age in CMD.
Future Plans • Aims • Finish Paper. • Reduce and analyse WHT data. • Create proposals for spectroscopy. • Examine remaining INT data (320GB). • Ambitions • Attend/talk at conferences. • Visit other departments/ collaborate. • Write thesis. • Get a job!!!
y=x3+6 walks into a bar and asks the bartender for the menu. He says ‘Sorry mate we don’t cater for functions!’