Download
1 / 23
230 likes | 330 Views
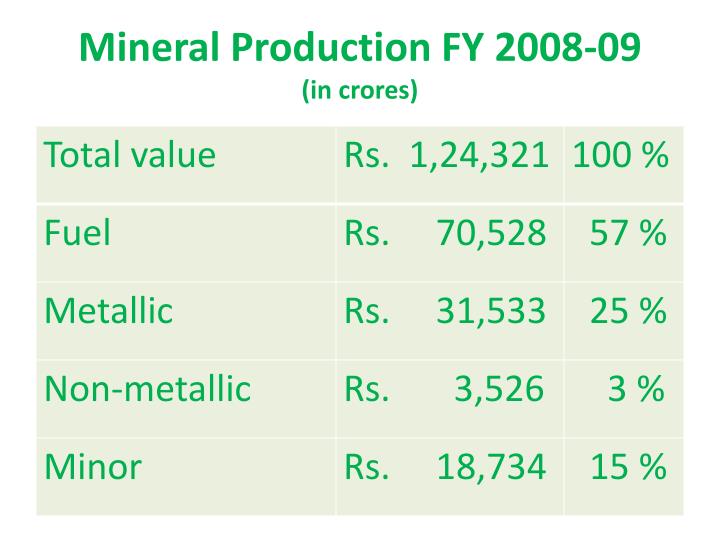
Mineral Production FY 2008-09 (in crores). Fuel Minerals – Coal. Chhattisgarh, Orissa, Jharkhand, Madhya Pradesh, Andhra Pradesh, Maharashtra, West Bengal and Uttar Pradesh accounted for 98.6% of the total production of coal in the country during 2008-09.

E N D
Fuel Minerals – Coal • Chhattisgarh, Orissa, Jharkhand, Madhya Pradesh, Andhra Pradesh, Maharashtra, West Bengal and Uttar Pradesh accounted for 98.6% of the total production of coal in the country during 2008-09. • The remaining 1.4% of the production was from Meghalaya and Assam.
Fuel Minerals – Coal Public Sector Undertakings (PSUs) account for some 90% of the coal production.
Fuel Minerals – Lignite Of the total lignite production in 2008-09, 66 % was reported from Tamil Nadu and the remaining 34 % was from Gujarat and Rajasthan.
Fuel Minerals – Lignite Taking into account the calorific value of lignite, its contribution to domestic fuel supply in the form of coal in the country is under 5%.
Fuel Minerals – Crude Petroleum • Offshore petroleum (crude) at 34 million tonnes during 2008-09 contributed 66%, followed by Gujarat 18% and Assam 14%. • The remaining 2% was jointly shared by Andhra Pradesh, Tamil Nadu, and Arunachal Pradesh.
Fuel Minerals – Natural Gas • Offshore natural gas (utilised), the largest source for natural gas accounted for 73% of the total production followed by Gujarat and Assam with 8% each. • The remaining 11% was contributed by Rajasthan, Tamil Nadu, Tripura, Andhra Pradesh and Arunachal Pradesh.
Role of the Public Sector The share of public sector in the total value of fuel minerals was 89%, in metallic minerals 42% and 27% in non-metallic minerals.
Role of the Public Sector The Public Sector had a sizeable contribution in production of coal (92%), petroleum (crude) (86%), and natural gas (utilised) (77%).
Employment • The estimated average daily employment of labour engaged in mining sector was 5,19,835 in 2008-09. • Of this, 81% were in public sector and 19% in private sector. • Fuel minerals accounted for 75%, metallic minerals 16% and non-metallic minerals 9% of the total labour force during the year.
Minerals & Ores in Indian Exports 1 During the year 2008-09, the value of exports (including re-exports) of ores and minerals at Rs. 1,09,296 crores accounted for 13 % of the total value of all merchandise exported from India.
Minerals & Ores in Indian Exports 2 Diamond (total) continued to be the largest constituent item with a share of 66.1% in the total value of mineral exports in 2008-09. Without diamonds, the total value of mineral exports in 2008-09 was only 37,051 crores.
Minerals & Ores in Indian Exports 3 Next in order of share was iron ore with the contribution of 19.9% followed by granite of 4.4% and alumina 1.5%. Iron Ore Rs. 21,750 crores.
Minerals & Ores in Indian Exports 4 The individual share of remaining minerals in the total value of exports of ores and minerals from India during the year under review was less than one per cent.
Metals in Indian Exports The contribution of metals & alloys in the total value of India’s exports was 9.8 % during 2008-09. (Ores and minerals accounted for 13 % of the total value of all Indian exports during 2008-09).
Indian Mineral Imports 1 The combined share of petroleum, diamond, coal, copper ore & concentrates and natural gas was about 96 % in 2008-09.
Indian Mineral Imports 1 Petroleum (crude) continued to be the largest constituent item with a share of 67.4% in the total value of mineral imports in 2008-09.
Indian Mineral Imports 2 Next in order of importance was diamond (total) with a share of 14.6% followed by coal (excluding lignite) with the contribution of 8%, copper ores & concentrates 3.5% and natural gas 2.5%.
Credits http://ibm.nic.in/imyb2009.htm (Site of the Indian Bureau of Mines, Nagpur)