Download
1 / 1
10 likes | 155 Views
t = 0. 10. 40. 60mins. Insulin bolus. t = 0. 10. 40. 60mins. Insulin bolus. Sepsis samples. Insulin & c-peptide samples. Insulin & c-peptide samples. 65 - 142 hours. Recovery samples. Objective

E N D
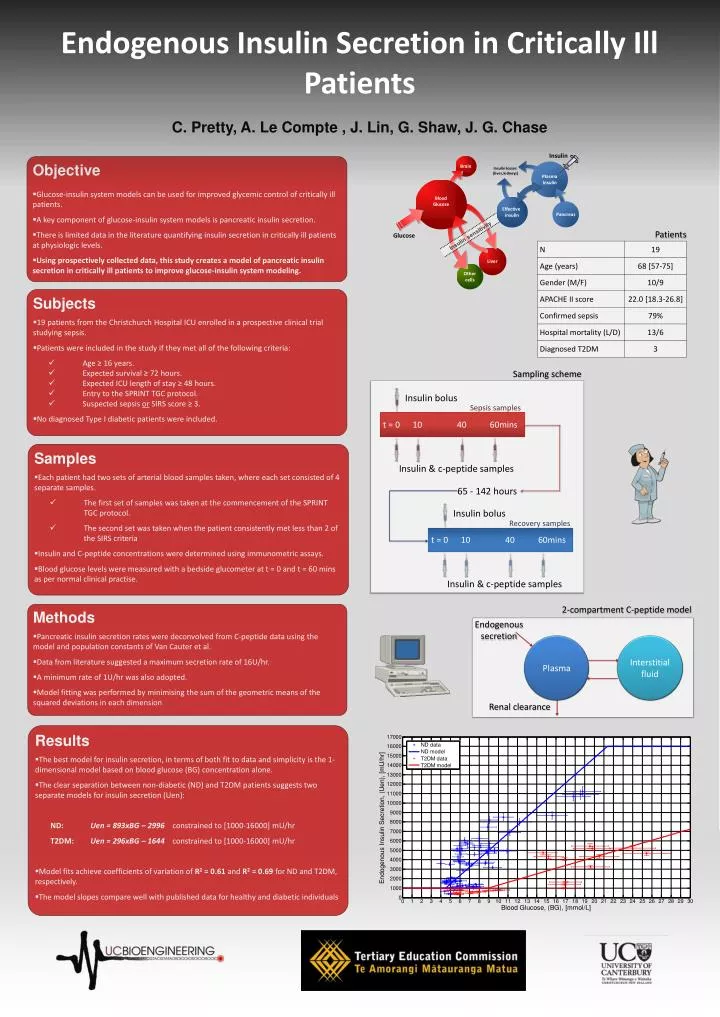
t = 0 10 40 60mins Insulin bolus t = 0 10 40 60mins Insulin bolus Sepsis samples Insulin & c-peptide samples Insulin & c-peptide samples 65 - 142 hours Recovery samples • Objective • Glucose-insulin system models can be used for improved glycemic control of critically ill patients. • A key component of glucose-insulin system models is pancreatic insulin secretion. • There is limited data in the literature quantifying insulin secretion in critically ill patients at physiologic levels. • Using prospectively collected data, this study creates a model of pancreatic insulin secretion in critically ill patients to improve glucose-insulin system modeling. Sampling scheme Patients • Subjects • 19 patients from the Christchurch Hospital ICU enrolled in a prospective clinical trial studying sepsis. • Patients were included in the study if they met all of the following criteria: • Age ≥ 16 years. • Expected survival ≥ 72 hours. • Expected ICU length of stay ≥ 48 hours. • Entry to the SPRINT TGC protocol. • Suspected sepsis or SIRS score ≥ 3. • No diagnosed Type I diabetic patients were included. Endogenous Insulin Secretion in Critically Ill Patients 2-compartment C-peptide model Endogenous secretion • Samples • Each patient had two sets of arterial blood samples taken, where each set consisted of 4 separate samples. • The first set of samples was taken at the commencement of the SPRINT TGC protocol. • The second set was taken when the patient consistently met less than 2 of the SIRS criteria • Insulin and C-peptide concentrations were determined using immunometric assays. • Blood glucose levels were measured with a bedside glucometer at t = 0 and t = 60 mins as per normal clinical practise. Plasma Interstitial fluid Renal clearance C. Pretty, A. Le Compte , J. Lin, G. Shaw, J. G. Chase • Methods • Pancreatic insulin secretion rates were deconvolved from C-peptide data using the model and population constants of Van Cauter et al. • Data from literature suggested a maximum secretion rate of 16U/hr. • A minimum rate of 1U/hr was also adopted. • Model fitting was performed by minimising the sum of the geometric means of the squared deviations in each dimension • Results • The best model for insulin secretion, in terms of both fit to data and simplicity is the 1-dimensional model based on blood glucose (BG) concentration alone. • The clear separation between non-diabetic (ND) and T2DM patients suggests two separate models for insulin secretion (Uen): • ND: Uen = 893xBG – 2996 constrained to [1000-16000] mU/hr • T2DM: Uen = 296xBG – 1644 constrained to [1000-16000] mU/hr • Model fits achieve coefficients of variation of R2 = 0.61 and R2 = 0.69 for ND and T2DM, respectively. • The model slopes compare well with published data for healthy and diabetic individuals