1 / 1

Chart 5.9: RN Employment by Type of Provider, 1980 – 2008 (1)

Chart 5.9: RN Employment by Type of Provider, 1980 – 2008 (1). All Other.

elvina
Download Presentation

Chart 5.9: RN Employment by Type of Provider, 1980 – 2008 (1)

An Image/Link below is provided (as is) to download presentation Download Policy: Content on the Website is provided to you AS IS for your information and personal use and may not be sold / licensed / shared on other websites without getting consent from its author. Content is provided to you AS IS for your information and personal use only. Download presentation by click this link. While downloading, if for some reason you are not able to download a presentation, the publisher may have deleted the file from their server. During download, if you can't get a presentation, the file might be deleted by the publisher.

E N D

Presentation Transcript


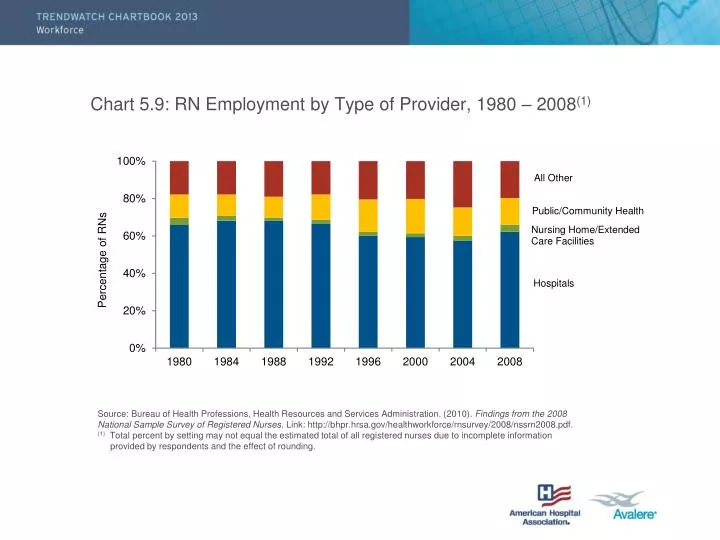
  1. Chart 5.9: RN Employment by Type of Provider, 1980 – 2008(1) All Other Source: Bureau of Health Professions, Health Resources and Services Administration. (2010). Findings from the 2008 National Sample Survey of Registered Nurses. Link: http://bhpr.hrsa.gov/healthworkforce/rnsurvey/2008/nssrn2008.pdf. (1) Total percent by setting may not equal the estimated total of all registered nurses due to incomplete information provided by respondents and the effect of rounding.

More Related