Download
1 / 18
250 likes | 510 Views
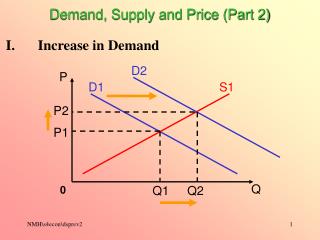
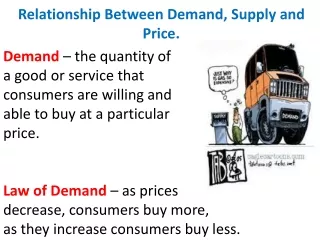
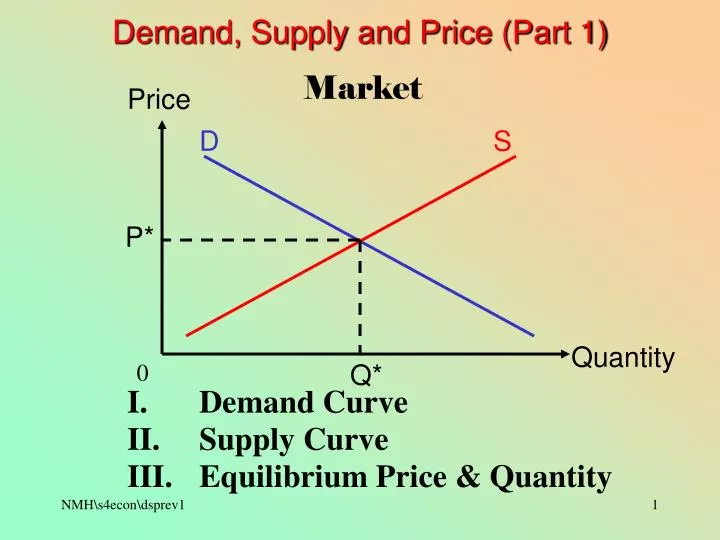
Price. D. S. P*. Quantity. 0. Q*. Demand, Supply and Price (Part 1). Market. I. Demand Curve. II. Supply Curve. III. Equilibrium Price & Quantity. Demand curve shows the quantities demanded at all prices. P. D. P ($). Qty demanded. Q. 0. 6. 3. Demand. 5. 4. 4. 5. 3. 6.

E N D
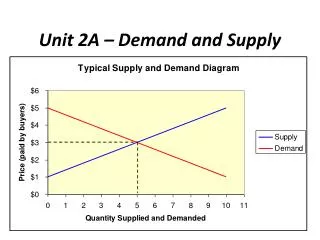
Price D S P* Quantity 0 Q* Demand, Supply and Price (Part 1) Market I. Demand Curve II. Supply Curve III. Equilibrium Price & Quantity
Demand curve shows the quantities demanded at all prices. P D P ($) Qty demanded Q 0 6 3 Demand 5 4 4 5 3 6 I. Demand 6 5 4 3 3 4 5 6
P D Q 0 The Law of Demand states that when the price of a good increases, the quantity demanded for the good will decrease, vice versa and ceteris paribus. P Qd P Qd Demand curve will be downward sloping.
D D It is wrong to say that: P D or P D D represents the entire demand curve. Its shifts are not caused by any change in the price of the good. It should be: P Qd or P Qd Movement along the same demand curve.
The entire plan of purchase: quantities demanded at all prices. It is represented by the entire demand curve. The quantity planned to buy at a particular price. It is represented by a point on the X-axis. Demand Quantity demanded Be careful!
The quantity planned to buy. The quantity has been bought actually. Quantity Demanded Quantity purchased Quantity bought Quantity transacted Be careful!
P Market demand curve is the horizontal summation of all individual demand curves. D Q 0 Da Db Dc IV. Market demand 24 6 8 10
Supply curve shows the quantities supplied at all prices. P S P ($) Qty supplied Q 0 6 5 Supply 5 4 4 3 3 2 II. Supply 6 5 4 3 2 3 4 5
P S Q 0 The Law of Supply states that when the price of a good increases, the quantity supplied of the good will increase, vice versa and ceteris paribus. P Qs P Qs Supply curve will be upward sloping.
S S It is wrong to say that: P S or P S It should be: P Qs or P Qs Supply Quantity supplied Quantity supplied Quantity sold Quantity transacted
Sf Sg Sh P Market supply curve is thehorizontal summationof all individual supply curves. S Q 0 IV. Market supply 27 5 9 13
P ($) Qty demanded Qty supplied P D S 6 3 5 5 4 4 6 4 5 3 5 3 6 2 4 3 Q 0 2 3 4 5 6 III. Equilibrium price and quantity
P D S 6 5 4 3 Qd Qs Q 0 2 3 4 5 6 Excess supply P= When P = $6, Qd = 3 unitsand Qs = 5 units. There will be an excess supply of 2 units (= 5 - 3). The price will decrease until no excess supply at all.
P D S 6 5 4 3 Qd Qs Q 0 2 3 4 5 6 Excess demand P= When P = $3, Qd = 6 unitsand Qs = 2 units. There will be an excess demand of 4 units (= 6 - 2). The price will increase until no excess demand at all.
P D S 6 5 4 3 Qd Qs Q 0 2 3 4 5 6 P= Equilibrium When P = $5, Qd = 4 unitsand Qs = 4 units. Equilibrium will appear, where $5 and 4 units are equilibrium price and quantity respectively.
not S > D not D > S the condition the condition Definitions: Excess supply or surplus means that the quantity supplied is greater than the quantity demanded at a price which is above the equilibrium price. Excess demand or shortage means that the quantity demanded is greater than the quantity supplied at a price which is below the equilibrium price.
not D = S no internal force to change the price Definitions: Equilibrium appears when the quantity demanded is equal to the quantity supplied; there will be no tendency for the price to change.
Demand, Supply and Price (Part 1) The End