Download
1 / 23
230 likes | 343 Views
Death Certification Reforms Potential impact on mortality statistics. Lucy Vickers, Lois Cook, John Blake Health Statistics User Group – March 2011. Today. Implications for mortality statistics Comparison study Discontinuities Conclusions and next steps. Mortality statistics .

E N D
Death Certification Reforms Potential impact on mortality statistics Lucy Vickers, Lois Cook, John Blake Health Statistics User Group – March 2011
Today • Implications for mortality statistics • Comparison study • Discontinuities • Conclusions and next steps
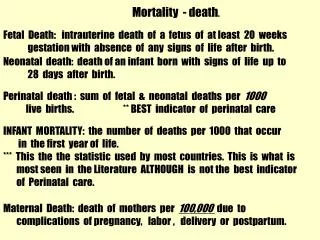
Mortality statistics Reported using the underlying cause of death Defined by World Health Organisation as a) The disease or injury which initiated the chain of morbid events leading directly to the death b) The circumstances of the accident or violence which produced the fatal injury Allows comparability of mortality statistics
Coding cause of death Condition recorded on the lowest used line of Part I of the certificate is usually the underlying cause of death However in the ICD there are selection and modification rules to ensure that UCD is derived from a valid sequence Automatic cause coding software incorporates these rules
Comparison Study Results Issues Limitations
Death certification pilot Data from pilot areas 1 November 2010 – 31 January 2011 650 records from 4 pilot areas Cause of death proposed by the certifier Cause of death proposed by the medical examiner Coded separately using automatic cause coding system Compared underlying cause of death and numbers of mentions
Results by cause ME confirmed cause of death in same ICD chapter • Cancer 97% (area range 91 - 100%) • Circulatory 89% (area range 87 -100 %) • Respiratory 79% (area range 77 - 100%) • Circulatory (128 deaths ) to respiratory (5) and 8 other chapters • Respiratory (101 deaths) moved to circulatory(8) , mental & behavioural (4) cancer (4) & 3 other chapters
Results by cause Where medical examiner confirmed death to be: • Cancer (150 deaths) certifier had proposed cancer (139 – 93%) respiratory (4) circulatory (2) or genitourinary (2) • Circulatory (137 deaths) certifier proposed circulatory (114 - 83 %) respiratory (8) & 10 other chapters • Respiratory (98 deaths) certifier proposed respiratory (80 - 82 % ) circulatory ( 5) genitourinary (4) & 6 other chapters
Medical examiner changes ME may consider that • Causal sequence is not correct • Other causes should be mentioned • Cause should be moved between Part I and Part II • Cause is not relevant
Number of mentions 282 (51%) records mentions identical (number, sequence and order) 161 (29%) records more mentions by medical examiner 39 (7%) records fewer mentions by medical examiner
Specificity • Did medical examiners make UCD more specific ? • Needs more analysis
Limitations Very small numbers of records to compare Some types of deaths excluded e.g. neonates Proportion of hospital v community deaths Pilot settings may not be representative of medical examiner implementation Difficult to select comparison groups for pilot data Data collection methods differed across the pilots Interval was not recorded in data sent to ONS
Further work on Comparison Study • Deaths reported to the coroner • Impact on delays between death and registration
Conclusions • Will be discontinuity in statistics by cause of death • Potential improvement in recording but trends likely to be turbulent due to changes in administrative process • Will need to be carefully analysed and presented for users of mortality statistics
Next steps • Further collection and analysis of pilot data • Development of outputs • Study design to analyse and explain discontinuities • UK • Communication plan for users • Documentation to explain discontinuities once first set of outputs available
Workshop questions • Do the discontinuities matter? • How important are the discontinuities – are they significant to users? • Why? • What uses/analysis will be particularly affected?
Workshop questions • What areas of analysis should be done? • Methods to be used? • Pilot data • Extended pilots across the country – early implementation areas • Whole country for a period of time • Comparisons with previous years • What information/explanation would you like to see? • Are particular causes of greater importance?
Workshop questions • What should we have on our communication plan to publicise impact of changes? • Further workshops • Articles • Explanation of discontinuity • What else would be useful? • When do you need information?