Download
1 / 48
490 likes | 643 Views
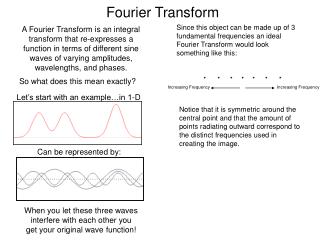
High-resolution Fourier transform emission spectroscopic study of the molecular ions. Yoshihiro Nakashima. Feb. 22. 2005. Contents. 1. General introduction. 2. B 2 S + – X 2 S + transition of the PN + ion. 3. A 2 P – X 2 P transition of the OCS + ion.

E N D
High-resolution Fourier transform emission spectroscopic study of the molecular ions Yoshihiro Nakashima Feb. 22. 2005
Contents 1. General introduction 2. B2S+ – X2S+ transition of the PN+ ion 3. A2P – X2P transition of the OCS+ ion 4. A2S+ – X2P transition of the BrCN+ ion
1. General introduction 2. B 2S+ – X 2S+ transition of the PN+ ion 3. A 2P – X 2P transition of the OCS+ ion 4. A 2S+ – X 2P transition of the BrCN+ ion Chapter 1 General introduction
Spectroscopic study Ion - molecule reaction Protonated ion Radical ion molecule + proton (H+) ionization of molecule closed shell open shell ex) H3O+, NH4+, H3+ … ex) N2+, CO2+, HCCH+ … Molecular ion (cationic species) Terrestrial and extraterrestrial environments flame plasma planetary atmosphere comet interstellar space etc….
Spectroscopic study of the radical ion Photoelectron spectroscopy Electronic energy of ion Laser spectroscopy MPI or REMPI + LIF or photodissociation Cavity ringdown etc… Matrix isolation spectroscopy High-sensitive detection present study Fourier transform spectrosocpy (FT) Flowing afterglow technique
FT Fourier transform spectrosocpy (FTS) M1 Michelson interferometer M2 S Interferogram F(x) B.S. x x : path difference F(x) D Spectrum B(n) n : wavenumber
Fourier transform spectrosocpy (FTS) High-resolution spectroscopy ( depend on x ) Determination of accurate frequency Wide spectral range ( 10 – 45,000 cm-1 for Brucker IFS120HR) Low signal to noise ratio Production method of transient species with high concentration and low noise… Flowing afterglow technique
eV 24 3 1P 23 3 3P 3 1S 3 3S 22 2 1P 21 2 3P 2 1S 20 2 3S 19 HeI 18 0 1 1S 1eV = 96. 5 kJ/mol De(N2) = 946 kJ/mol Flowing afterglow The reaction of molecule with metastable He ( 21S ) : 20.61 eV, t = 19.7 ms He ( 23S ) : 19.81 eV, t~ 150 min metastable Electronic energy level of He
He ( 11S )He* ( 23Sor 21S) He* + M ( M+)* + He + e- He* + M M* + He ( 11S ) ( M+ )* M+ + hn M*( M+ )* + e- Penning ionization optical spectroscopy ( PIOS ) Flowing afterglow Penning ionization 1. low noise 2. stable emission 3. selective production of the ion
1. General introduction 2. B 2S+ – X 2S+ transition of the PN+ ion 3. A 2P – X 2P transition of the OCS+ ion 4. A 2S+ – X 2P transition of the BrCN+ ion Chapter 3 A 2P – X 2P transition of OCS+
eV 20 B2S+ A2P v = 0 15 4S- X2P v = 0 11 R(OC-S) Introduction Isovalent with CO2+ and CS2+ Predissociation in A 2P 1. repulsive 4S- 2. Internal conversion from A 2P to X 2P Spectroscopic study is few! M. J. Hubin-Frank et al. ( MCSCF-CI )
cm-1 B 2S+ 39,180 A 2P W=1/2 31,400 W=3/2 W=1/2 X 2P W=3/2 0 Previous works 1. Oschner et al. LIF spectra of the (000)-(000) band of theA2 P3/2 -X 2P3/2transition. 2. Kakoschke et al. Photodissociation spectra of the A2 P- X 2PandB2 S+- X 2P transitions. 3. Weinkauf and Boesl Photodissociation spectra of the (000)-(000) bandof the A2 P1/2 - X 2P1/2transition. 4. C. L. Lugez et al. Infrared absorption spectrum in Ne matrix.
He*(23S) + OCS OCS+ + He(11S) Experimental Penning ionization He (2.5 Torr) (I.P.=11.19 eV) OCS (2-3 mTorr) resolution : 0.03 cm-1 spectral region : 20,000 – 28,000 cm-1 accumulation time : 60 hrs.
He OCS+ CO+ (2,1) CO+ (1,0) CO+ (2,0) S+ OCS+ He CO+ (3,0) OCS+ CO+ (4,0) OCS+ Observed spectrum cm-1
(000)-(005) (000)-(004) (000)-(003) (000)-(002) A 2P – X 2P transition of OCS+ n3 (CO str.) progression cm-1
R (J’’) 65.5 P (J’’) 58.5 50.5 40.5 30.5 20.5 10.5 A 2P3/2(000) – X 2P3/2(003) transition FWHM : 0.05 cm-1 Trot : 300 K
R 66.5 60.5 P R 5.5 J’’=2.5 J’’=1.5 5.5 Q A 2P3/2(000) – X 2P3/2(003) transition R (1.5) and P(2.5) Weak Q branch A 2P3/2 – X 2P3/2 transition
FWHM : 0.05 cm-1 Trot : 300 K R (J’’) P (J’’) 0.5 10.5 46.5 40.5 30.5 20.5 10.5 6.5 A 2P1/2(000) – X 2P1/2(003) transition
+ parity J’’=26.5 J’’=23.5 - parity A 2P1/2(000) – X 2P1/2(003) transition P-branch L –type doubling A 2P1/2 – X 2P1/2 transition
state constant W=3/2 W=1/2 A 2PT000 31404.1021(25) 31145.3089(99) B000 0.186823(12) 0.187396 (29) 107D000 0.395(24) 0.395 p/2 +q - 0.0008(11) X 2Pw3 2089.8512(80) 2085.6308(30) x33 19.7997(66) 19.7997 y333-0.5097(18) -0.5097 z3333 0.01016(16) 0.01016 B000 0.194634(13) 0.194805(28) 107D000 0.619(32) 0.561(21) 103 a3 0.6432(20) 0.6136(51) 108 b3 0.327(53) 0.327 105 g33 0.106(33) 0.106 p/2 +q - 0.0040(10) W W W W Molecular constants(unit : cm-1)
parameter X 2PA 2PX1S+ w1 (CS str.) present study 690 815 - previous study 695.7 804.8 858.95 ab initio 697 843 904 w3 (CO str.) present study 2087.741 -- previous study 2071.1 2036 2062.22 ab initio 2166 2282 2161 Discussion Harmonic frequency w1 (CS str.) : w1 = ( 4Be3/De)1/2 w3 (CO str.) : ( w33/2 + w31/2 ) /2
3/2 B000 = B000 (1 + B000/A) W W B00v = B000 -a3v + g33v2 Weinkauf and Boesl 1/2 B000 = B000 (1 -B000/A) B000(X) = 0.194719(15) cm-1 B000(A) = 0.187110(16) cm-1 Oschner et al W=1/2 W=3/2 Rotational constants
3/2 B000 = B000 (1 + B000/A) 2P1/2 A2P 2P3/2 1/2 -122.2 B000 = B000 (1 -B000/A) 3/2 1/2 |T000 – T000| = |A’ – A’’| A(X) = -380.9(66) cm-1 2P1/2 A (A) = -122.2(66) cm-1 X2P -380.9 2P3/2 Spin-orbit interaction constants (A’ = -111.8) (A’’ = -367.2)
parameter X 2PA 2PX1S+ rCO (A) present study 1.104 1.253 - previous study 1.136 1.252 1.16021 ab initioa 1.129 1.267 1.157 rCS (A) present study 1.657 1.589 - previous study 1.634 1.606 1.56014 ab initioa 1.657 1.589 1.571 Bond length of OCS+ a : K. Takeshita et al. (MRSD-CI) (8s)2 (9s)2 (2p)4 (3p)3: X 2P 3p : S 3p(non-bonding) (8s)2 (9s)2 (2p)3(3p)4 : A 2P 2p : CO p (bonding)
Summary 1. Ultraviolet emission spectrum of the A2P - X2P transition of the OCS+ ion was observed by FT spectroscopy. 2. Rotational analysis of the seven bands, A2P3/2 (000) - X2P3/2 (00v) ( v=0, 2-5 ) and A2P1/2 (000) - X2P1/2 (00v) ( v=3 and 4 ) transitions, were performed to determine the molecular constants. 3. Spin-orbit interaction constants A and the harmonic frequencies w1 and w3 of A2P and X2P were determined. 4. The geometrical difference between X2P and A2Pwas indicated, which was explained by the electronic configuration.
1. General introduction 2. B 2S+ – X 2S+ transition of the PN+ ion 3. A 2P – X 2P transition of the OCS+ ion 4. A 2S+ – X 2P transition of the BrCN+ ion Chapter 4 A 2S+ – X 2P transition of BrCN+
Introduction BrCN+ ion Electronic ground state : X 2P Renner-Teller effect Vibronic interaction Splitting of the vibronic state by the excitation of the bending vibration spin-orbit interaction
Bending potential function V+ = a ( 1 + e) (dr)2 + … e : Renner parameter V- = a ( 1 – e) (dr)2 + … |e|<1 |e|>1 NCO, N2O+( X 2P ) NH2( X 2B1 , A 2P )
A = -1477 cm-1 287.24 cm-1 w2 = 287.24(20) cm-1 1477cm-1 Introduction Large spin-orbit interaction Influence of the spin-orbit interaction on the Renner-Teller effect
(012) (002) cm-1 (001) B 2P3/2 19,230 A 2S+ 13,700 (100) X 2P3/2 0 Previous works 1. J.Fulara et al. Low-resolution emission spectra of the B 2 P3/2-X2 P3/2 and A 2 S+-X 2 Ptransitions 2. M. A. Hanratty et al. LIF spectra of the B 2 P3/2- X 2 P3/2 transition 3. M. Rosslein et al. LIF spectra of the B 2 P3/2- X 2 P3/2 transition to determine the rs-structureof BrCN+ 4. C. Salud et al. Infrared diode laser spectroscopy of the n1(CN str.) fundamental band of theX 2 P3/2state
He*(23S) + BrCN BrCN+ + He(11S) Experimental Penning ionization He (1.0 Torr) (I.P.=12.08 eV) BrCN (2-3 mTorr) resolution : 0.02 cm-1 spectral region : 11,500 – 15,000 cm-1 accumulation time : 40 hrs.
W=3/2 (000)-(000) (100)-(100) (010)-(001) (000)-(010) (010)-(010) (001)-(001) (001)-(011) (010)-(000) W=1/2 (000)-(000) (000)-(010) (001)-(001) (010)-(010) (000)-(100) Observed spectrum ( A 2S+ - X 2PW )
P21 + Q1 R1 + Q21 P1 R21 A 2S+ (000) - X 2P3/2 (000) transition
79BrCN+ J’’=39.5 J’’=35.5 81BrCN+ J’’=39.5 J’’=35.5 A 2S+ (000) - X 2P3/2 (000) transition P1 branch
P2 + Q12 R12 + Q2 P12 R2 A 2S+ (000) - X 2P1/2 (000) transition
state constant FT + D.L. D.L. LIF A 2 S+ n3/2 13697.1192(13) B 0.1411698(51) 107D 0.346(16) g - 0.017752(37) X 2 P3/2B3/2 0.1414036(47) 0.1413799(41) 0.141536(47) 107D 0.307(15) 0.158(23) 0.86(28) state constant FT + D.L. D.L. LIF A 2 S+ n3/2 13697.1613(13) B 0.1403581(50) 107D 0.299(16) g - 0.017672(37) X 2 P3/2B3/2 0.1405939(47) 0.140582(11) 0.140859(86) 107D 0.262(14) 0.147(60) 1.5(56) Molecular constants (unit : cm-1) A2S+(000) – X2P3/2(000) transition 79BrCN+ eff 81BrCN+ eff
state constant 79BrCN+81BrCN+ A 2 S+ n1/2 12220.6523(46) 12220.6762(59) B 0.14117a 0.14036a 107D 0.346a 0.299a g - 0.0178a -0.0177a X 2 P1/2B1/2 0.1416173(62) 0.1407575(67) 107D 0.347(11) 0.214(16) p/2 + q 0.00600(11) 0.00501(15) eff B3/2 = B000 ( 1 + B000 /A ) B1/2 = B000 ( 1 -B000 /A ) eff eff Molecular constants (unit : cm-1) A2S+(000) – X2P1/2(000) transition Rotational constant B000 79B000 = 0.1415105(32) cm-1 81B000 = 0.1406757(41) cm-1
n1/2 n3/2 A Spin-orbit interaction constant A 2S+ (000) low resolution emission spectroscopy A = - 1477 cm-1 A = n1/2 – n3/2 X 2P1/2 79A = -1476.4669(48) cm-1 81A = -1476.4841(60) cm-1 X 2P (000) X 2P3/2
zC Br C N × G zBr zN species electronic state rBrC rCN BrCN X 1 S+1.789 1.158 BrCN+X 2 P1.788(54) 1.103(78) 1.745(7) 1.195(8) A 2 S+1.814(61) 1.064(90) D I = zBr2 DmBrS mk DmBr + S mk unit : A r0-structure I = Smkzk2 0 = S mkzk
P12 R12 P2 R2 A 2S+ - m2Stransition
P21 R21 P1 R1 A 2S+ - k2Stransition
A2S+ - m 2S state constant 79BrCN+81BrCN+ A 2 S+ nm 13410.1135(12) 13410.2424(17) B 0.14117a 0.14036a 107D 0.346a 0.299a g -0.0178a -0.0177a m2 S B m 0.1419339(19) 0.1411504(26) 107D 0.3165(60) 0.3493(79) p-0.020312(27) -0.020187(32) A2S+ - k 2S state constant 79BrCN+81BrCN+ A 2 S+ nk 11921.6949(21) 11921.8374(25) B 0.14117a 0.14036a 107D 0.346a 0.299a g -0.0178a -0.0177a k2 S B k 0.1420853(25) 0.1412934(28) 107D 0.3035(58) 0.3139(66) p-0.018749(46) -0.018563(52) Molecular constants (unit : cm-1)
Bk = B010+ [ (B010 – g/2) cos 2b ]2/2r Bm = B010- [ (B010 – g/2) cos 2b ]2/2r g : spin-rotation interaction constant A 2S+(000) nm nk k2S 2r X 2P(010) m2S Discussion Rotational constants B010 79B010 = 0.1420111(23) cm-1 81B010 = 0.1412625(25) cm-1 Parameter r 2r = [ Aeff2 + 4(ew2)2 ]1/2 = nm - nk 279r = 1488.4186(24) cm-1 281r = 1488.4050(30) cm-1
state constant 79BrCN+81BrCN+ m2 Sp-0.020312(27) -0.020187(32) k2 Sp-0.018749(46) -0.018563(52) B010 0.1420111(23) 0.1412625(25) 2r 1488.4186(24) 1488.4050(30) w2 287.24(20) Renner parameter p : W –type doubling constant p = 2B010sin 2b = 4B010ew2/2r e : Renner parameter BO2 (X 2P) e = -0.19 CO2+ (X 2Pu) e = -0.190 79e = -0.18529(27) 81e = -0.18512(32)
sin 2b = ew2/2 cos 2b = Aeff/2 Wave fuctions of m2S and k2S sin2b : cos2b = 0.0040 : 0.9959 Large spin-orbit interaction !
Summary 1. Near-infrared emission spectrum of the A2S+ - X2P transition of the BrCN+ ion was observed by FT spectroscopy. 2. Rotational analysis of the four bands, A2S+ (000) - X2PW (000) ( W=3/2 and 1/2 ) A2S+ (000) - m2S and A2S+ (000) - k2S, was performed to determine the molecular constants. 3. The r0-structures of BrCN+ were obtained and geometrical difference between BrCN and BrCN+ was small. 4. Renner parameter was determined to be e = -0.185, and the influence of the Renner-Teller effect on X 2P was turned out to be small due to the large spin-orbit interaction.
Conclusion 1. Fourier Transform spectroscopy was combined with flowing afterglow technique to detect the polyatomic radical cation. 2. Electronic transitions of linear triatomic radical cations were observed by FT spectroscopy. 3. Accurate molecular constants were determined by the analysis of the observed vibronic bands. 4. Bond lengths and the harmonic frequencies of the ions were derived from the molecular constants. 5. The analysis of the Renner-Teller effect was accomplished.
Fe(CO)5 + hn (193 nm) FeCO HCCH + Hg* ( 3P ) HCCH* + Hg ( 1S ) Future works 1. Detection of the radical species ArF excimer laser (193 nm) = 6.42 eV N2*( A 3S+ ) = 6.22 eV, t=1.36 sec. 2. Detection of the triplet state of the molecule Hg* ( 3P ) = 5.46 eV 3. Vibrational transition of the ionic or radical species Emission or absorption spectrum of the transient species