Download
1 / 16
220 likes | 538 Views
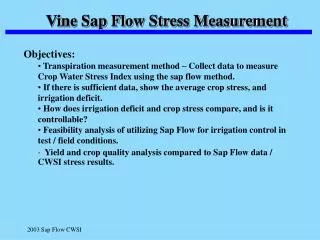
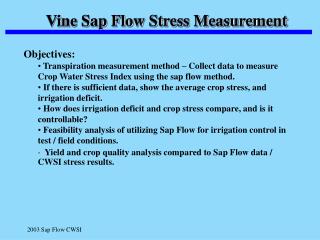
Vine Sap Flow Stress Measurement. Objectives: Transpiration measurement method – Collect data to measure Crop Water Stress Index using the sap flow method. If there is sufficient data, show the average crop stress, and irrigation deficit.

E N D
Vine Sap Flow Stress Measurement • Objectives: • Transpiration measurement method – Collect data to measure Crop Water Stress Index using the sap flow method. • If there is sufficient data, show the average crop stress, and irrigation deficit. • How does irrigation deficit and crop stress compare, and is it controllable? • Feasibility analysis of utilizing Sap Flow for irrigation control in test / field conditions. • Yield and crop quality analysis compared to Sap Flow data / CWSI stress results.
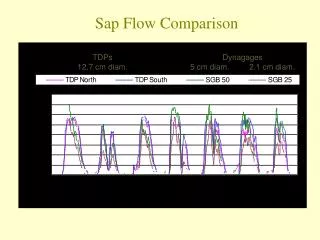
Study outline – Cuesta Ridge Vinyard, Robert Mondavi Sap flow sensors – 4 SGB25 installed in rows as shown. Soil moisture sensor ML2- ThetaProbe at logger 18 inch deep next to a vine. ET provided by nearest CIMIS network station. Installation and training provided by Dynamax Aug 13 2003.
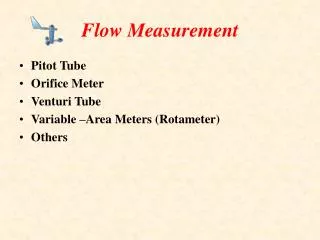
Transpiration - Sap Flow Measurements • Transpiration measurement method - • Dedicated data logger – Flow4 • Four sap flow sensors with • Dynagage heat balance method • Solar power – batteries installed • Soil Moisture Sensor – ThetaProbe • Input Parameters for vineyard into Flow4 processor Plant Density Area Irrigation efficiency % Evaporation % Stem area (or leaf area) Field stem average area (or leaf area index) • Options for automatic water balance were were not used in this study: • Tipping Bucket Rain gage - rainfall is not a factor in this area. • Flow Meter – irrigation applied, however was recorded manually. • Valve Control – scheduled by water deficit, days for irrigation. Valves were operated by timer in this study and adjusted by vineyards manager.
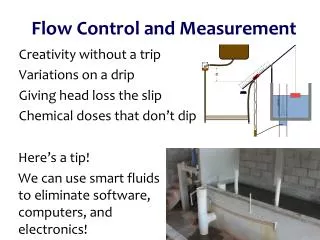
Sap Flow – MethodsSap Flow sensor operation – Heat Balance Method (SHB)
Sap Flow Sensor Method • Sensor installation: • Sensor with heater wraps all around the stem. • Sensor insulated from radiation, stem insulated below and above sensor. • Sap flow sensor measures heat absorbed and temperature rise. Then logger converts results to mass flow. • 4 sensors automatically indexed for vine stem-size to the crop average. • Sap flow results saved hourly and accumulated daily. • Sap flow is converted to mm water used in Flow4.
Sap Flow Water Stress Theory • 1)Perform comparison from demand ETo to actual water transpired – under well watered conditions. • Determine the actual Crop Coefficient (Kc)on site • Measure Sap Flow continuously (ETa), record maximum daily transpiration relative to ETo, (ETm). Data may be converted to mm water used. • Record ETo from automatic weather station. • Compute : • Kc = ETm / ETo (mm/mm) • During well watered conditions, day after thorough irrigation. (Idso, 1982) • 2) Compute the transpiration stress index during any subsequent day by: • CWSI = 1 – ETa / ETm (Idso, 1982, Jackson et. Al. 1981) • ETa= Actual transpiration; ETm = ETww - maximum transpiration projected by weather condition. • ETm = Kc*Eto • Ex: CWSI= 0 ~ no transpiration stress. • Ex: CWSI= .5 ~ means transpiration is 50% of the maximum well watered condition. • 3)With evapotranspiration records, summed daily, stress is observed in progress after irrigations.
10.8 11.2 15.2 15.5
SF=.31* ET SF=.31* ET SF=.18* ET
SF=.30* ET SF= .30 ET SF=.16* ET
Stress =0 %
Conclusions: • Water stress index can be calculated real time with daily tracking of sap flow and ET under field conditions. • The Sap Flow CWSI method is unique in showing reaction to weather and water application with collection of the required parameters. • ETm and the correlated Crop Coefficient, Kc can be derived at any time with sap flow data, however the irrigation status and water status must be observed.
Conclusions: • Flow4 Sap Flow is sufficiently accurate and responsive to correlate sap flow with ET provided that four sensors are weighted and averaged to the crop. Sensors were properly installed and maintained. ET from a nearby weather station is required. • Irrigation deficit and the Transpiration stress are controllable and appear correlated. More data over complete season is needed for a variety of conditions. • Soil moisture provides a valuable check point for irrigation status. More observations would be required to correlate stress vs soil moisture. • Crop yield and quality compared to CWSI was not known and would require more study. Plant or leaf water status was not available to correlate to sap flow CWSI and should provide additional analytical comparison.