Download
1 / 15
180 likes | 349 Views
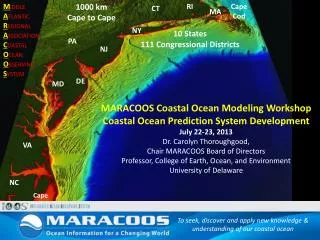
Ocean Deoxygenation and Coastal Hypoxia i n a Changing World ”. GESAMP 39 18 April 2012 Nancy N. Rabalais et al. Louisiana Universities Marine Consortium nrabalais@lumcon.edu http://www.gulfhypoxia.net. Goolsby et al. 1999, Rabalais 2002. Point Source 10%. Nonpoint Source 90%.

E N D
Ocean Deoxygenation and Coastal Hypoxia in a Changing World” GESAMP 39 18 April 2012 Nancy N. Rabalais et al. Louisiana Universities Marine Consortium nrabalais@lumcon.edu http://www.gulfhypoxia.net
Goolsby et al. 1999, Rabalais 2002 Point Source 10% Nonpoint Source 90%
Nutrient Yields from the Mississippi Basin Alexander et al. 2008 & http://water.usgs.gov/nawqa/sparrow/gulf_findings/
Mississippi River – Gulf of Mexico Ecosystem Continuum Hypoxic Area Mississippi River Atchafalaya River New Orleans Effects are more far reaching than suspended sediment plume, esp. N & somewhat P dominant wind direction Source: N. Rabalais
Extensive, Severe Low Oxygen Waters Source: N. Rabalais, LUMCON • up to 22,000 km2 • 4 - 5 m nearshore to 35 - 45 m offshore • 0.5 km nearshore to 100+ km offshore • widespread and severe in Jun – Sep
April 29 rain June 18 rain
Mississippi River Discharge Hydrographs Tarbert Landing, MS (1930-2011) Trans C&F Shelfwide Heterosigma bloom * 2011 2010 maximum Cubic feet per second x 1000 average minimum *
Heterosigmaakashiwo Station: C6C, approx 15 miles south of LUMCON (29o 52.12 N / 90 o 29.42 W) Date: March 21, 2011 Bottom Depth: 19.5 m Bloom Color: Greenish-brown Salinity: 28.7 psu Chlorophyll: 117 ug/L Oxygen: 204% oxygen saturation DO: 16-17 mg/L
Predicting Hypoxia in summer (nitrate-N flux in May, year) Turner et al. 2006
Distribution of bottom-water dissolved oxygen July 18-21 (east of the Mississippi River delta) and July 24-30 (west of the Mississippi River delta), 2011. Mississippi River LA TX LA MS AL Atchafalaya River Data source: NN Rabalais, Louisiana Universities Marine Consortium, and RE Turner, Louisiana State University. Funding source: National Oceanic and Atmospheric Administration, Center for Sponsored Coastal Ocean Research. http://www.gulfhypoxia.net
Anthropogenic activities Climate variability climate change Sea level rise (+) Water temperature (mostly +) Winds Reactive N (mostly +) Hydrologic cycle (+) (-) Nutrient loads (+) (-) Biological responses (Metabolic rates mostly +) (Primary production +) (Respiration +) Physical environment (Stratification +) (Oxygen saturation -) (Current shifts) (Tropical storms) Nutrient-enhanced productivity Harmful & noxious algal blooms Vertical carbon flux Bottom-water hypoxia Sedimentary carbon and nutrient pools Rabalais et al. 2009, 2010
7,000 120 Symptoms of Eutrophication 6,000 100 5,000 80 4,000 60 3,000 40 2,000 20 1,000 0 0 1800 1850 1900 1950 2000 2050 Humans, millions Fertilizer, Tg N Legumes/Rice, Tg N NOx emissions, Tg N They are increasing Developed Countries Developing Countries (modified by N. Rabalais;Galloway and Cowling 2002; Boesch 2002)
The Future Climate Change Biofuels Increased Population Increased Agribusiness Increased Atmospheric Deposition