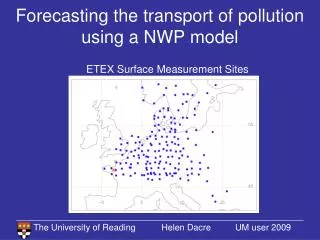
Download
1 / 23
230 likes | 365 Views
Evaluation of Envisat data using a NWP Assimilation System: A vortex-centred view. Authors: W.A. Lahoz, S. Migliorini, R. Bannister, R. Brugge, A. O’Neill Data Assimilation Research Centre, Reading, UK Thanks: ESA, Envisat cal-val teams, Met Office (UK), CNR.IFAC, BADC. Talk overview.

E N D
Evaluation of Envisat data using a NWP Assimilation System: A vortex-centred view Authors: W.A. Lahoz, S. Migliorini, R. Bannister, R. Brugge, A. O’Neill Data Assimilation Research Centre, Reading, UK Thanks: ESA, Envisat cal-val teams, Met Office (UK), CNR.IFAC, BADC
Talk overview • Aims • Methodology • Results - Qualitative - Quantitative • Conclusions • Further Work
Aims • Evaluate L2 GOMOS, MIPAS & SCIAMACHY data (AOID 1039) • Height-resolved and total column data - Temperature - Ozone - Water vapour
Methodology • Apply to L2 data (unassimilated): vortex-centred view • Vortex-centred view used to look at UARS MLS water vapour data (Lahoz et al, JAS 1994; QJRMS 1996) • Self-consistency • Comparison against independent datasets • Qualitative/quantitative comparisons • Later: apply to L2+ data (assimilated into a NWP system)
1hPa 10hPa Results: qualitative • 24/Oct/2002 • Geopotential Height: Met Office 12 GMT • 1, 10, 100hPa • MIPAS orbit track 18.42 – 19.30 GMT S GM ID E 100hPa Orbit track
1hPa Results: qualitative 10hPa • 24/Oct/2002 • Temperature MIPAS (top) • Temperature Met Off (bottom) • Along orbit track 100hPa S E 1hPa 10hPa 100hPa S E
1hPa Results: qualitative 10hPa • 24/Oct/2002 • Ozone MIPAS (top) • Water vapour MIPAS (bottom) • Along orbit track 100hPa S E 1hPa 10hPa 100hPa S E
1hPa Results: qualitative 10hPa • 24/Oct/2002 • CH4 MIPAS (top) • N2O MIPAS (bottom) • Along orbit track 100hPa S E 1hPa 10hPa 100hPa S E
1hPa Results: qualitative 10hPa • 24/Oct/2002 • HNO3 MIPAS (top) • NO2 MIPAS (bottom) • Along orbit track 100hPa S E 1hPa 10hPa Day Night 100hPa S E
1hPa Results: qualitative • 27/Sep/2002 • MIPAS v sondes (Ny Alesund: 78.9N, 11.9E) • Temperature (top; K) • Ozone (bottom; ppmv) 1000hPa 180 300 1hPa 1000hPa 0 15
1hPa Results: qualitative • 27/Sep/2002 • MIPAS v sondes (Payerne: 46.8N, 7.0E) • Temperature (top; K) • Ozone (bottom; ppmv) 1000hPa 180 300 1hPa 1000hPa 15 0
1hPa Results: qualitative • 27/Sep/2002 • MIPAS v sondes (Marambio: 64.3S, 56.7W) • Temperature (top; K) • Ozone (bottom; ppmv) 1000hPa 180 300 1hPa 1000hPa 0 15
Results: qualitative • 25/Sep/2002 • Total ozone column SCIAMACHY & footprint • Total ozone column analyses (KNMI/ ESA)
Results:quantitative MIPAS Averaging Kernels • MIPAS v Sonde ( x AK) • Jokioinen (60.8N, 23.5E) • 18 Sep 2002 • Chi-squared test • Temperature (K) Red star: MIPAS Green diamond: Sonde x AK
Results:quantitative -1 +1 +1 -1 • MIPAS v Sonde ( x AK) • Ny Alesund • 200hPa->10hPa • September 2002 • Ozone (LH) • Temperature (RH)
Results:quantitative • MIPAS v Sonde( x AK) • Several stations • 200hPa->10hPa • September 2002 • Ozone (LH) • Temperature (RH)
Results: quantitative • 23/Sep/2002 • Histogram • SCIAMACHY – KNMI/ESA (Total ozone / DU) • GOME bias not removed
Results: quantitative • 24/Sep/2002 • Histogram • SCIAMACHY – KNMI/ESA (Total ozone / DU) • GOME bias not removed
Results: quantitative • 25/Sep/2002 • Histogram • SCIAMACHY – KNMI/ESA (Total ozone / DU) • GOME bias not removed
Data Assimilation • Struthers, Brugge, Lahoz, O’Neill & Swinbank, JGR 2002 • Cal-val:O: Observations, A: Analyses, B: Background/Forecast - Impact of observations: OSEs - Stability & Bias: O-A differences - Normality of Errors: O-B histograms - Best Linear Unbiased Estimate (BLUE): rms(O-A) - Comparison against independent data
Conclusions MIPAS: results suggest: • Consistency between MIPAS data & meteorology • Temperature, ozone vs independent data (sondes x AK): • temperature better characterised than ozone; unrealistic vertical oscillations in temperature retrieval • ozone errors too small (systematic error needed); ozone has a positive bias • MIPAS temperature and ozone errors are close to Gaussian
Conclusions SCIAMACHY: results suggest: • SCIAMACHY total column ozone data agrees well with GOME analyses (N.B. GOME biases not removed): • bias magnitude ~6DU (bias can be positive/negative) • std of differences ~20 DU (Errors are close to Gaussian) • consistent with GOME analyses bias (see BIRA/IASB web-site) GOMOS • Air density in GOMOS needed work (Sep); may be OK now
Further Work • MIPAS water vapour data (compare vs balloons) • SCIAMACHY total ozone column biases • GOMOS data (ozone, water vapour) • Assimilation into Met Office system (MIPAS ozone data assimilated for 6 hours & evaluating experiment) - Cal-val - Combine limb and nadir geometries: ASSET project - Averaging kernels/theory