Download
1 / 50
500 likes | 594 Views
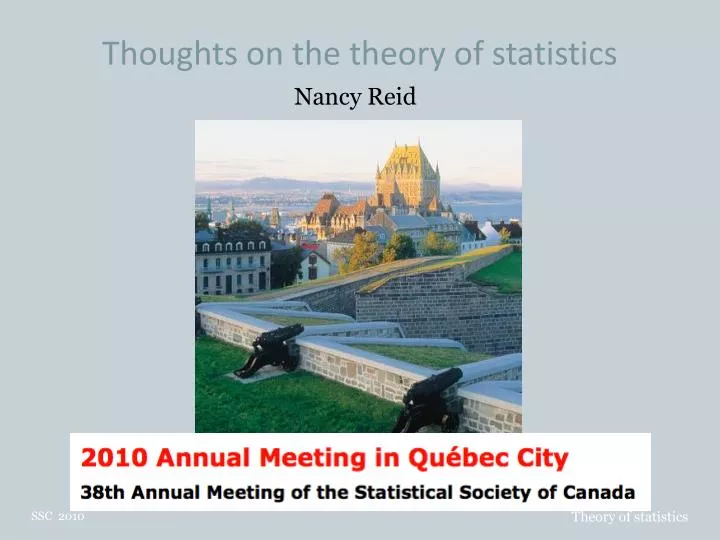
Thoughts on the theory of statistics. Nancy Reid. Statistics in demand. “Statistical science is undergoing unprecedented growth in both opportunity and activity” High energy physics Art history Reality mining Bioinformatics Complex surveys Climate and environment SSC 2010 … .

E N D
Thoughts on the theory of statistics Nancy Reid SSC 2010
Statistics in demand “Statistical science is undergoing unprecedented growth in both opportunity and activity” High energy physics Art history Reality mining Bioinformatics Complex surveys Climate and environment SSC 2010 … SSC 2010
Statistical Thinking Dramatic increase in resources now available SSC 2010
Statistical Thinking 1 • If a statistic was the answer, what was the question? • What are we counting? • Common pitfalls • means, medians and outliers • How sure are we? • statistical significance and confidence • Percentages and risk • relative and absolute change SSC 2010
Statistical theory for 20xx • What should we be teaching? • If a statistic was the answer, what was the question? • Design of experiments and surveys • Common pitfalls • Summary statistics: sufficiency etc. • How sure are we? • Inference • Percentages and risk • Interpretation SSC 2010
Models and likelihood • Modelling is difficult and important • We can get a lot from the likelihood function • Not only point estimators • Not only (not at all!!) most powerful tests • Inferential quantities (pivots) • Inferential distributions (asymptotics) • A natural starting point, even for very complex models SSC 2010
Likelihood is everywhere! 2 SSC 2010
Outline • Higher order asymptotics likelihood as pivotal • Bayesian and non-Bayesian inference • Partial, quasi, composite likelihood • Where are we headed? SSC 2010
P-value functions from likelihood SSC 2010
P-value functions from likelihood 0.975 0.025 SSC 2010
Can be nearly exact Likelihood root Maximum likelihood estimate Score function All approximately distributed as Much better : can be SSC 2010
Can be nearly exact Likelihood root Maximum likelihood estimate Score function SSC 2010
Can be nearly exact SSC 2010
Can be nearly exact SSC 2010
Can be nearly exact SSC 2010
Can be nearly exact SSC 2010
Can be nearly exact 3 SSC 2010
Using higher order approximations • Excellent approximations for ‘easy’ cases • Exponential families, non-normal linear regression • More work to construct for ‘moderate’ cases • Autoregressive models, fixed and random effects, discrete responses • Fairly delicate for ‘difficult’ cases • Complex structural models with several sources of variation • Best results for scalar parameter of interest • But we may need inference for vector parameters SSC 2010
Where does this come from? 4Amari, 1982, Biometrika; Efron, 1975, Annals SSC 2010
Where does this come from? 5,6,7 Differential geometry of statistical models Theory of exponential families Edgeworth and saddlepoint approximations Key idea: A smooth parametric model can be approximated by a tangent exponential family model Requires differentiating log-likelihood function on the sample space Permits extensions to more complex models SSC 2010
Where does this come from? 8 SSC 2010
Generalizations To discrete data Where differentiating the log-likelihood on the sample space is more difficult Solution: use expected value of score statistic instead Relative error instead of Still better than the normal approximation SSC 2010
Generalizations 9 SSC 2010
Generalizations 10 To vector parameters of interest But our solutions require a single parameter Solution: use length of the vector, conditioned on the direction SSC 2010
Generalizations 11 • Extending the role of the exponential family • By generalizing differentiation on the sample space • Idea: differentiate the expected log-likelihood • Instead of the log-likelihood • Leads to a new version of approximating exponential family • Can be used with pseudo-likelihoods SSC 2010
What can we learn? 12 Higher order approximation requires Differentiating the log-likelihood function on the sample space Bayesian inference will be different Asymptotic expansion highlights the discrepancy Bayesian posteriors are in general not calibrated Cannot always be corrected by choice of the prior We can study this by comparing Bayesian and nonBayesian approximations SSC 2010
Example: inference for ED50 13 • Logistic regression with a single covariate • On the logistic scale • Use flat priors for • Parameter of interest is • Empirical coverage of Bayesian posterior intervals: • 0.90, 0.88, 0.89, 0.90 • Empirical coverage of intervals using • 0.95, 0.95, 0.95, 0.95 SSC 2010
Flat priors are not a good idea! 14 SSC 2010
Flat priors are not a good idea! SSC 2010
Flat priors are not a good idea! Bayesian p-value – Frequentistp-value SSC 2010
More complex models Likelihood inference has desirable properties Sufficiency, asymptotic efficiency Good approximations to needed distributions Derived naturally from parametric models Can be difficult to construct, especially in complex models Many natural extensions: partial likelihood for censored data, quasi-likelihood for generalized estimating equations, composite likelihood for dependent data SSC 2010
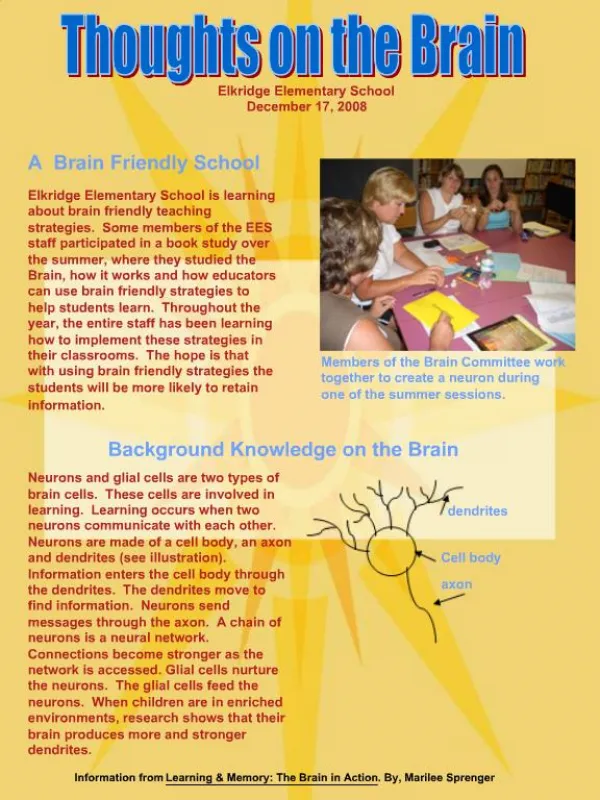
Complex models 14 Example: longitudinal study of migraine sufferers Latent variable Observed variable E.g. no headache, mild, moderate, intense … Covariates: age, education, painkillers, weather, … random effects between and within subjects Serial correlation SSC 2010
Likelihood for longitudinal discrete data Likelihood function Hard to compute Makes strong assumptions Proposal: use bivariate marginal densities instead of full multivariate normal densities Giving a mis-specified model SSC 2010
Composite likelihood Composite likelihood function More generally Sets index marginal or conditional (or …) distributions Inference based on theory of estimating equations SSC 2010
A simple example 16 • Pairwise likelihood estimator of fully efficient • If , loss of efficiency depends on dimension • Small for dimension less than, say, 10 • Falls apart if for fixed sample size • Relevant for time series, genetics applications SSC 2010
Composite likelihood estimator Godambe information SSC 2010
Recent Applications 17 Longitudinal data, binary and continuous: random effects models Survival analysis: frailty models, copulas Multi-type responses: discrete and continuous; markers and event times Finance: time-varying covariance models Genetics/bioinformatics: CCL for vonMises distribution: protein folding; gene mapping; linkage disequilibrium Spatial data: geostatistics, spatial point processes SSC 2010
… and more Image analysis Rasch model Bradley-Terry model State space models Population dynamics … SSC 2010
What can we learn? SSC 2010
What do we need to know? Why are composite likelihood estimators efficient? How much information should we use? Are the parameters guaranteed to be identifiable? Are we sure the components are consistent with a ‘true’ model? Can we make progress if not? How do joint densities get constructed? What properties do these constructions have? Is composite likelihood robust? SSC 2010
Why is this important? Composite likelihood ideas generated from applications Likelihood methods seem too complicated A range of application areas all use the same/similar ideas Abstraction provided by theory allows us to step back from the particular application Get some understanding about when the methods might not work As well as when they are expected to work well SSC 2010
The role of theory Abstracts the main ideas Simplifies the details Isolates particular features In the best scenario, gives new insight into what underlies our intuition Example: curvature and Bayesian inference Example: composite likelihood Example: false discovery rates SSC 2010
False discovery rates 18 • Problem of multiple comparisons • Simultaneous statistical inference – R.G. Miller, 1966 • Bonferroni correction too strong • Benjamini and Hochberg, 1995 • Introduce False Discovery Rate • An improvement (huge!) on “Type I and Type II error” • Then comes data, in this case from astrophysics • Genovese & Wasserman collaborating with Miller and Nichol SSC 2010
False discovery rates 19 SSC 2010
Speculation 20 Composite likelihood as a smoother Calibration of posterior inference Extension of higher order asymptotics to composite likelihood Exponential families and empirical likelihood Semi-parametric and non-parametric models connected to higher order asymptotics Effective dimension reduction for inference Ensemble methods in machine learning SSC 2010
Speculation 21 “in statistics the problems always evolve relative to the development of new data structures and new computational tools” … NSF report “Statistics is driven by data” … Don McLeish “Our discipline needs collaborations” … Hugh Chipman How do we create opportunities? How do we establish an independent identity? In the face of bureaucratic pressures to merge? Keep emphasizing what we do best!! SSC 2010
Speculation • Engle • Variation, modelling, data, theory, data, theory • Tibshirani • Cross-validation; forensic statistics • Netflix Grand Prize • Recommender systems: machine learning, psychology, statistics! • Tufte • “Visual Display of Quantitative Information” -- 1983 SSC 2010
http://recovery.gov 787,000,000,000 $
Thank you!! SSC 2010
End Notes “Making Sense of Statistics” Accessed on May 5, 2010.http://www.senseaboutscience.org.uk/ Midlife Crisis: National Post, January 30, 2008. Alessandra Brazzale, Anthony Davison and Reid (2007). Applied Asymptotics. Cambridge University Press. Amari (1982). Biometrika. Fraser, Reid, Jianrong Wu. (1999). Biometrika. Reid (2003). Annals Statistics Fraser (1990). J. Multivariate Anal. Figure drawn by Alessandra Brazzale. From Reid (2003). Davison, Fraser, Reid (2006). JRSS B. Davison, Fraser, Reid, Nicola Sartori (2010). in progress Reid and Fraser (2010). Biometrika Fraser, Reid, ElisabettaMarras, Grace Yun-Yi (2010). JRSSB Reid and Ye Sun (2009). Communications in Statistics J. Heinrich (2003). Phystat Proceedings C. Varin, C. Czado (2010). Biostatistics. D.Cox, Reid (2004). Biometrika. CL references in C.Varin, D.Firth, Reid (2010). Submitted for publication. Account of FDR and astronomy taken from Lindsay et al (2004). NSF Report on the Future of Statistics Miller et al. (2001). Science. Photo: http://epiac1216.wordpress.com/2008/09/23/origins-of-the-phrase-pie-in-the-sky/ Photo: http://www.bankofcanada.ca/en/banknotes/legislation/images/023361-lg.jpg SSC 2010