Download
1 / 28
280 likes | 382 Views
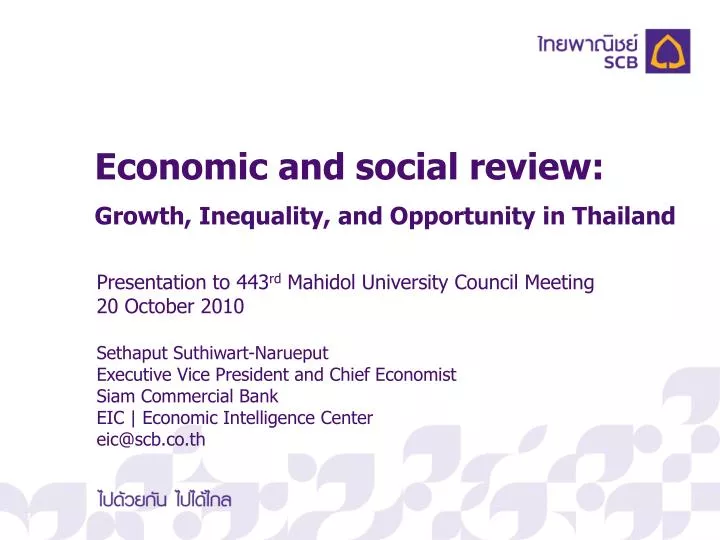
Economic and social review: Growth, Inequality, and Opportunity in Thailand. Presentation to 443 rd Mahidol University Council Meeting 20 October 2010 Sethaput Suthiwart-Narueput Executive Vice President and Chief Economist Siam Commercial Bank EIC | Economic Intelligence Center

E N D
Economic and social review: Growth, Inequality, and Opportunity in Thailand Presentation to 443rd Mahidol University Council Meeting 20 October 2010 Sethaput Suthiwart-Narueput Executive Vice President and Chief Economist Siam Commercial Bank EIC | Economic Intelligence Center eic@scb.co.th
Size relative to the US จีนและอินเดียมีขนาดไม่ใหญ่พอที่จะแทนที่เศรษฐกิจของกลุ่ม G3 GDP at current prices in 2009 Unit: Trillion USD 100% 88% 36% 34% 9% Source: SCB EIC analysisbased on data from IMF World Economic Outlook Database (April 2010)
กลไกตลาดสินเชื่อในสหรัฐฯ ยังไม่ทำงาน US securitization issuance(asset-backed and mortgage-backed securities) Unit: Billion USD 1,671 219 183 84 2010 Aug YTD Source: SCB EIC analysis based on data from Securities Industry and Financial Markets Association (SIFMA)
การจ้างงานในสหรัฐฯ ยังอยู่ระดับเดียวกับปี 2004 Total US employment* Unit: million persons Note: Figures are as of August * Persons 16 years and over in the civilian non-institutional population who, during the reference week, (a) did any work at all (at least 1 hour) as paid employees; worked in their own business, profession, or on their own farm, or worked 15 hours or more as unpaid workers in an enterprise operated by a member of the family; and (b) all those who were not working but who had jobs or businesses from which they were temporarily absent because of vacation, illness, bad weather, childcare problems, maternity or paternity leave, labor-management dispute, job training, or other family or personal reasons, whether or not they were paid for the time off or were seeking other jobs Source: SCB EIC analysis based on data from US Bureau of Labor Statistics (BLS)
GDP ปี 2011 น่าจะขยายตัวได้ประมาณ 3.5 - 4.5% Contribution to Thailand 2011 real GDP growth by components Unit: percentage points Source: SCB EIC forecast
2010 - 2020 2010 - 2020 AND LONGER TERM? อัตราการเติบโตของกำลังแรงงานในทศวรรษหน้าจะต่ำลง หน่วย: % อัตราการเติบโตเฉลี่ยสะสม (CAGR) 2000 - 2010 2000 - 2010 Philippines Malaysia Vietnam Thailand
17 Wage 21 Non-wage 9 Monthly wage 8 Daily wage and others แรงงานประจำอยู่ในระดับต่ำ หน่วย: ล้านคน 38Labor force
GDP ขยายตัวต่อเนื่อง แต่ค่าจ้างกลับไม่เพิ่ม หน่วย: ดัชนี 2001=100 148 Real GDP 100
“Even though the Thai economy has established an impressive record of economic growth, the income distribution is quite uneven and a geographic imbalance still exists. The incomes in the urban areas are generally about twice higher than those in the rural communities, and the average income in the metropolitan area of Bangkok is more than triple those in villages in the Northeast. This disparity raises the potential danger not only of an economic nature but of political subversion as well. “ • --From NESDB, Evaluation of the First Six-Year Plan 1961-1966
Inequality remains stubbornly high Percent of population and income (in 2007) Unit: % Richest 20% 55% 60% 41% Poorest 20% 4% % of population % of total income Source: SCB EIC analysis based on data from National Economic and Social Development Board (NESDB)
Lowest income in the Northeast regardless of occupation Average monthly household income per member by region and occupation in 2007 Unit: THB Bangkok South Central North Northeast Small farmer Construction worker Production worker Service worker Professional Entrepreneur Note: Entrepreneurs include only enterprises with employees. Professionals include those who are employees. Small farmers include farm operators with their own land smaller than 20 rai. In the case that household members have different occupations, the head of household’s occupation is used as the reference. Source: SCB EIC analysis based on data from SES (NSO)
Gaps remain large with little signs of catching up Average monthly household income per member by occupation in 1990 and 2007 (current prices) Unit: THB Entrepreneur in Bangkok Professional in Bangkok Production worker in Bangkok Production worker in the Northeast Small farmer in the Northeast Note: Entrepreneurs include only enterprises with employees. Professionals include those who are employees. Small farmers include farm operators with their own land smaller than 20 rai. In the case that household members have different occupations, the head of household’s occupation is used as the reference. Source: SCB EIC analysis based on data from Socio-economic survey (SES), National Statistical Office (NSO)
Larger steps up the income ladders require skills, education, or access to capital Household income per member in 2007 (index) Unit: index (100= small farmer in the Northeast (2,190 THB)) Small farmer in the Northeast Construction worker in the Northeast Construction worker in Bangkok Production worker in Bangkok Service worker in Bangkok Professional in Bangkok Entrepreneur in Bangkok Note: Entrepreneurs include only enterprises with employees. Professionals include those who are employees. Small farmers include farm operators with their own land smaller than 20 rai. In the case that household members have different occupations, the head of household’s occupation is used as the reference. Source: SCB EIC analysis based on data from SES (NSO)
Quality education is the key to success Average monthly wages by educational attainment and age group in 2007 Unit: THB 28,000 Tertiary Secondary 15,000 10,000 6,000 5,500 Primary 5,000 Age group Source: SCB EIC analysis based on data from Labor Force Survey (NSO)
INEQUALITY OF INCOME and INEQUALITY OF OPPORTUNITY • “Equality of opportunity is best served by providing universal access to public services, like health and education, and by meritocratic systems in government and the private sector.” • --From Commission on Growth and Development (2008), • The Growth Report: Strategies for Sustained Growth and Inclusive Development
EDUCATION: Unequal access to higher education Number of universities in 2009* Population in 2009 Unit: universities Unit: million persons Bangkok Northeast * Includes public and private universities Source: SCB EIC analysis based on data from Office of Higher Education Commission and NESDB
2001 2005 People in Bangkok are 4 times more likely to enroll in higher education that those in the Northeast Higher education participation rate by region (ages 20 and over) Unit: % Source: SCB EIC analysis based on data from Labor Force Survey (NSO)
More clerks and service workers, but fewer professionals Share by occupation among college graduates aged 20-25 Unit: % Others Clerk Professional Service worker Source: SCB EIC analysis based on data from Labor Force Survey (NSO)
HEALTH:A lot more physicians in Bangkok and big provinces.... Population per physician in 2007 Unit: persons Top 5 provinces Bottom 5 provinces Source: SCB EIC analysis based on data from Thailand human development index (2009) of United Nations Development Programme
Wide gap in population per hospital bed... Population per hospital bed in 2007 Unit: persons Top 5 provinces Bottom 5 provinces Source: SCB EIC analysis based on data from Ministry of Public Health
รถพยาบาล เครื่องล้างไต เครื่องอัลตร้าซาวด์ เครื่องเลเซอร์ เครื่องสลายนิ่ว MRI CT scan ...as well as in medical equipment Number of medical equipments in 2007 Unit: units 2,112 325 Top 5 provinces 273 261 198 36 34 Bottom 5 provinces 28 26 23 Source: SCB EIC analysis based on data from Ministry of Public Health
Cancer is the most common cause of death from disease in 2008, led by liver cancer which accounted for 14,000 out of 55,000deaths from cancer Insufficient saving to pay for medical treatment, especially for deadly disease Annual household income and expenditure for average self-employed entrepreneur in the Northeast and cancer expense in 2007 Unit: THB/person/year Incomes Food Housing Others Savings** Liver cancer expense * Minimum expense for liver cancer treatment in mid-range private hospital ** Excludes medical expenditure Source: SCB EIC analysis based on data from Socio-Economic Survey of National Statistical Office, a private hospital, and Ministry of Public Health
Inequity in medical benefit packages Budget per person of health insurance systems Unit: THB/person/year Social Security Scheme Universal Coverage Civil Servant Senators Office of Auditor General Office of National Anti-Corruption Commission Constitu-tional Court Parliament-arian Note: CSMBS (Civil Servant Medical Benefit Scheme) covering about 5 million people uses a budget of 65,000 million baht or 13,000 baht per person; SSS (Social Security Scheme) covers about 9.8 million and about to receive another 5.8 million from the Universal Coverage (UC) program; UC covering about 47.3 million uses a budget of only 89,000 million baht or 1,894 baht per person Source: Data from Pokpermdee and Patanavanich (2010), National Health Security Office
Disclaimer The information contained in this document has been obtained from sources believed to be reliable. However, neither we nor any of our respective affiliates, employees or representatives makes any representation or warranty, express or implied, as to the accuracy or completeness of any of the information contained in this document, and we and each of such persons expressly disclaims any and all liability relating to or resulting from the use of this document or such information by the recipient and any persons in whatever manner. Any opinions presented herein represent the subject views of ours and our current estimates and judgments which are based on various assumptions that may be subject to changes without notice, and may or may not prove to be correct. This document is for the recipient's information only. It does not represent or constitutes an advice, offer, recommendation, or solicitation by us and should not be relied as such. We or any of our associates may also have an interest in the companies mentioned herein.