Download
1 / 5
50 likes | 63 Views
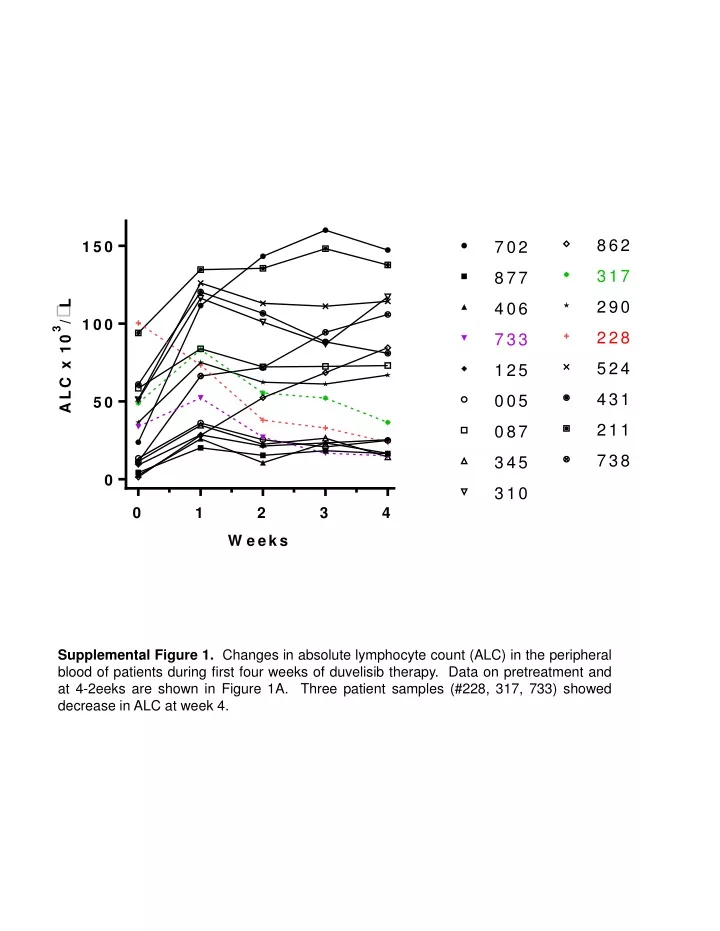
Supplemental Figure 1. Changes in absolute lymphocyte count (ALC) in the peripheral blood of patients during first four weeks of duvelisib therapy. Data on pretreatment and at 4-2eeks are shown in Figure 1A. Three patient samples (#228, 317, 733) showed decrease in ALC at week 4.

E N D
Supplemental Figure 1. Changes in absolute lymphocyte count (ALC) in the peripheral blood of patients during first four weeks of duvelisib therapy. Data on pretreatment and at 4-2eeks are shown in Figure 1A. Three patient samples (#228, 317, 733) showed decrease in ALC at week 4.
Real-time RT-PCR assay (n=5) Supplemental Figure 2. Fold change in BCL2 mRNA expression in CLL cells after one cycle (28 days) of duvelisib therapy. CLL cells were isolated from peripheral blood of patients before and after a cycle of duvelisib treatment and RNA was isolated and real-time RT-PCR assay was done to quantitate BCL2 transcript. Each symbol represents a patient sample. C2D1, cycle 2 day 1; C1D1, cycle 1 day 1.
A NL AML B-ALL B-ALLped CLL CML MDS ProB T-ALL 74 542 147 559 448 76 206 70 174 Note: Grouped by Cancer Type: log2 median-centered intensity. Colors are z-score normalized to depict relative values within rows. They cannot be used to compare values between rows. B Different datasets cannot be used to compare differences in values of BCL-2 expression rather indicate expression level of BCL-2 gene in respective dataset. Supplemental Figure 3. A) Comparison of BCL2 mRNA expression in CLL cells compared to that in normal lymphocytes or other leukemia cells. Nl, normal lymphocyte; AML, acute myelogenous leukemia; B-ALL, B-cell acute lymphoblastic leukemia; ped, pediatric; CLL, chronic lymphocytic leukemia; CML, chronic myelogenous leukemia; MDS, myelodysplastic syndrome; proB; pro-B-cell lymphocytic leukemia; T-ALL, T-cell acute lymphoblastic leukemia. Numbers under diagnosis represent total sample size per disease. B) Endogenous expression of BCL2 mRNA in CLL cells (retrospective Oncomine data) in different datasets. X-axis indicates first author’s name from the respective publication. References are provided in the Supplemental Methods. Oncomine Source: https://www.oncomine.com/resource/main.html#d:149670397.
Supplemental Figure 4. Comparison of fold change in absolute lymphocyte count (ALC) versus fold change in Bcl-2 protein expression measured though RPPA analysis after one cycle of duvelisib therapy. C1D1, cycle 1 day 1; C2D1, cycle 2 day 1
Supplemental Figure 5. Correlation of fold-change in Bcl-2 protein expression with that in Bim protein expression after one cycle of duvelisib treatment. Protein expressions of Bcl-2 and Bim from 16 CLL samples were measured using RPPA analysis as described in materials and methods. C1D1, cycle 1 day 1; C2D1, cycle 2 day 1.