Download
1 / 1
10 likes | 282 Views
X + >X - , Y>1. ( P) +. ( R) -. ( R) +. ( P) -. X + =X - , Y=1. 1975 Haicheng earthquake. 2001 Kunlun earthquake. 1976 Tangshan earthquake. X - = Lim ( R - / P - ). X + = Lim ( R + / P + ). P + 0. P - 0. ( P) +. ( R) -. ( R) +. ( P) -.

E N D
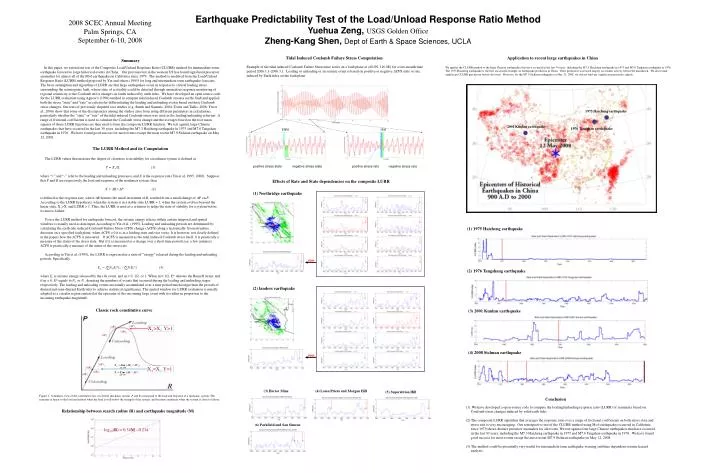
X+>X-, Y>1 (P)+ (R)- (R)+ (P)- X+=X-, Y=1 1975 Haicheng earthquake 2001 Kunlun earthquake 1976 Tangshan earthquake X- = Lim (R- / P-) X+ = Lim (R+ / P+) P+0 P-0 (P)+ (R)- (R)+ (P)- Earthquake Predictability Test of the Load/Unload Response Ratio Method Yuehua Zeng, USGS Golden Office Zheng-Kang Shen, Dept of Earth & Space Sciences, UCLA 2008 SCEC Annual Meeting Palm Springs, CA September 6-10, 2008 Tidal Induced Coulomb Failure Stress Computation Application to recent large earthquakes in China Summary In this paper, we extend our test of the Composite Load/Unload Response Ratio (CLURR) method for intermediate-term earthquake forecast to large historical events in China. Our previous test in the western US has found significant precursor anomalies for almost all of the M>6 earthquakes in California since 1979. The method is modified from the Load/Unload Response Ratio (LURR) method proposed by Yin and others (1995) for long and intermediate term earthquake forecasts. The basic assumption and algorithm of LURR are that large earthquakes occur in response to critical loading stress surrounding the seismogenic fault, whose state of criticality could be detected through anomalous response monitoring of regional seismicity to the Coulomb stress changes on faults induced by earth tides. We have developed an open source code for the LURR evaluation using Agnew’s (1996) method to compute tidal induced Coulomb stresses on the fault and applied both the stress “state” and “rate” as criteria for differentiating the loading and unloading events based on those Coulomb stress changes. Our tests of previously disputed case studies (e.g. Smith and Sammis, 2004; Trotta and Tullis, 2006; Yin et al., 2006) show that some of the discrepancies among the studies arise from using different parameters in calculations, particularly whether the “state” or “rate” of the tidal induced Coulomb stress was used as the loading/unloading criterion. A range of frictional coefficients is used to calculate the Coulomb stress change and the averages based on the root mean squares of those LURR functions are then used to form the composite LURR function. We test against large Chinese earthquakes that have occurred in the last 30 years, including the M7.3 Haicheng earthquake in 1975 and M7.6 Tangshan earthquake in 1976. We have found good success for most events except the most recent M7.9 Sichuan earthquake on May 12, 2008. The LURR Method and its Computation The LURR values that measure the degree of closeness to instability for a nonlinear system is defined as Y = X+/X- (1) where “+” and “-” refer to the loading and unloading processes, and X is the response rate (Yin et al, 1995; 2000). Suppose that P and R are respectively the load and response of the nonlinear system, then X = R / P (2) is defined as the response rate, where R denotes the small increment of R, resulted from a small change of P on P. According to the LURR hypothesis, when the system is in a stable state LURR 1; when the system evolves beyond the linear state, X+>X- and LURR > 1. Thus, the LURR is used as a criterion to judge the state of stability for a system before its macro-failure. To use the LURR method for earthquake forecast, the seismic energy release within certain temporal and spatial windows is usually used as data input. According to Yin et al. (1995), Loading and unloading periods are determined by calculating the earth tide induced Coulomb Failure Stress (CFS) change (CFS) along a tectonically favored rupture direction on a specified fault plane: when CFS > 0 it is in a loading state and vice versa. It is however, not clearly defined in the papers how the CFS is measured. If CFS is measured as the tidal induced Coulomb stress itself, it is practically a measure of the status of the stress state. But if it is measured as a change over a short time period (say, a few minutes), CFS is practically a measure of the status of the stress rate. According to Yin et al. (1995), the LURR is expressed as a ratio of “energy” released during the loading and unloading periods. Specifically, Ym = (∑N+Eim)+ / (∑N-Eim)- (3) where Ei is seismic energy released by the i-th event, and m = 0, 1/2, or 1. When m = 1/2, Em denotes the Benioff strain; and if m = 0, Em equals to N+ or N-, denoting the numbers of events that occurred during the loading and unloading stages respectively. The loading and unloading events are usually accumulated over a time period much longer than the periods of diurnal and semi-diurnal Earth tides to achieve statistical significance. The spatial window for LURR evaluation is usually adopted as a circular region centered at the epicenter of the oncoming large event with its radius in proportion to the incoming earthquake magnitude. Example of the tidal induced Coulomb Failure Stress time series on a fault plane at (40.0N, 116.0E) for a two-month time period 2006.1.1-2006.3.1. Loading or unloading or an seismic event is based on positive or negative CFS state or rate induced by Earth tides on the fault plane We applies the CLURR method to the large Chinese earthquakes that have occurred in the last 30 years, including the M7.3 Haicheng earthquake in 1975 and M7.6 Tangshan earthquake in 1976. The 1975 Haicheng earthquake is the first successful example on earthquake prediction in China. Their prediction was based largely on seismic activity before the mainshock. We also found significant CLURR precursory before the event. However, for the M7.9 Sichuan earthquake on May 12, 2008, we did not find any significant precursory signals. state rate positive stress state negative stress state positive stress rate negative stress rate Effects of Rate and State dependencies on the composite LURR (1) Northridge earthquake (1) 1975 Haicheng earthquake sum (2) 1976 Tangshang earthquake (2) landers earthquake Classic rock constitutive curve (3) 2001 Kunlun earthquake (4) 2008 Sichuan earthquake sum (4) Loma Prieta and Morgan Hill (3) Hector Mine (5) Superstition Hill Figure 1. Schematic view of the constitutive law of a brittle mechanic system. P and R correspond to the load and response of a mechanic system. The response is linear to the load and unload when the load is well below the strength of the system, and becomes nonlinear when the system is close to failure. Conclusion • We have developed a open-source code to compute the loading/unloading response ratio (LURR) of seismicity based on Coulomb stress changes induced by solid earth tides. • (2) The composite LURR algorithm that averages the response ratio over a range of frictional coefficients on both stress state and stress rate is very encouraging. Our retrospective test of the CLURR method using M>6 earthquakes occurred in California since 1979 shows distinct precursor anomalies for all events. We test against four large Chinese earthquakes that have occurred in the last 30 years, including the M7.3 Haicheng earthquake in 1975 and M7.6 Tangshan earthquake in 1976. We have found good success for most events except the most recent M7.9 Sichuan earthquake on May 12, 2008. • (3) The method could be potentially very useful for intermediate term earthquake warning and time dependent seismic hazard analysis. Relationship between search radius (R) and earthquake magnitude (M) (6) Parkfield and San Simeon log10(R) = 0.34M - 0.214 State, step = 2 mo, window = 1 yr, R = 150 km