Download
1 / 31
310 likes | 429 Views
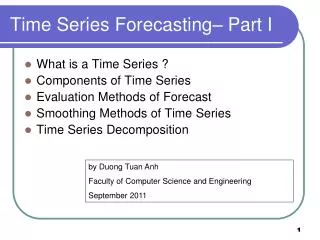
Week 9: Series RC Circuit. Experiment 14. Circuit to be constructed. It is good practice to short the unused pin on the trimpot when using it as a variable resistor. Velleman function generator. Shunt resistor. Current Measurement: Shunt Resistor.

E N D
Week 9: Series RC Circuit Experiment 14
Circuit to be constructed It is good practice to short the unused pin on the trimpot when using it as a variable resistor Velleman function generator Shunt resistor
Current Measurement:Shunt Resistor • Oscilloscopes can measure voltage as a function of time, but they can’t measure current. • To measure time-varying current, we include a small resistor at the bottom of the branch in which the current measurement is desired. • The value of the resistor chosen should be at least a factor of 10 times smaller than the other resistors in the branch. • The voltage across the small resistor divided by its resistance yields the current through the branch.
Measurement point for voltage across capacitor 100nF Measurement point for input voltage 10 Measurement point for current through resistor where V(t)/10W equals the current.
Time Constant • The time constant (t) is defined asthe time it takes the circuit to reach63.2% of the maximum or fall to 36.8% of the minimum possible voltage orcurrent. (at t = t, [1 – et/t] = [1- e-1] = 0.63212) • After 2 time constants, the circuit has reached ≈86% of maximum. • After 5 time constants, VC and IL are near 100% of the maximum, and VL and IC are near 0.
Transient Response:Period of Input Voltage ≥ 5t Steady state values for the capacitor’s voltage and current are assumed to be reached by the time t = 5t. Plot your data in Matlab as a single plot (do NOT plot in XL!).
Transient Response:Period of Input Voltage < 5t In these cases, the generator changes voltage before the voltage and current waveforms approach steady state.
MatLab ProgramInclude the appropriate plots into the report template • Plot a graph of vC(t) versus t for Equations (1) + (2) and (7) + (8) as described in the lab manual for Experiment 14. Set the frequency of the square wave to create the clock signal in Figure 4. • Plot a graph of iC(t) versus t given by Equations (5) + (6) and the derivative of Equations (7) + (8) as described in the lab manual for Experiment 14. Set the frequency of the square wave to create the clock signal in Figure 4.
PSpice Simulations:Transient Analysis • Plot of the voltage across the capacitor as a function time • Use either Vpulse or Digclock as the voltage source • Instructions on setting up a transient simulation using these sources are posted under Resources/Technical Support: Circuit Simulation • Include the input voltage in the plot and show three periods. • Plot of the current through the capacitor as a function time • Plot of the voltage across the shunt resistor divided by its resistance as a function time • Instructions on how to perform calculations in the PSpice plotting routine are posted under Resources/Technical Support: Circuit Simulation. • Use a current marker instead of a voltage marker • Show three complete waveform periods.
Time Constant of RC Circuit • Calculated using multiple methods: • Analytically (Step 1) • Experimentally after measurements of R, C, and Rshunt • Note that you have the ability to measure capacitance on your digital multimeter • From a curve fit of V(t) as the voltage across the capacitor decreases when the input voltage changes from +5V to ground. • This is done for each time constant.
Voltage Measurements • Set the scope function generator such that Vin is a square wave that swings from 0V to +5V. • Settings for the square wave are 5V amplitude with 2.5V offset. • The duty cycle is 50%. • Frequency should be set to 1 kHz. • Use DC coupling on Channel 1 and Channel 2 • Ignore the comments in the lab manual about AC coupling unless you select AC Coupling when performing the measurements. • Ignore all comments in the instructions about a sound card or the Zeitnitz oscilloscope software program.
No Extra Credit • No credit will be given for “Extra Credit Question” step 32, so you do not need to complete this step.
Square Wave Sources:Digclock and Vpulse Directions given for PSpice Schematics
Digclock The continuous set of pulses do not start until time = 2ms (DELAY = 2us) . The initial voltage is 0V (STARTVAL = 0). Once the pulses start, the pulse length at 0V is 0.5ms (OFFTIME = 0.5us) and the pulse length at 5V is 0.5 ms (ONTIME = 0.5us).
Output of Digclock Note the 2μs start delay
Digclock The continuous set of pulses start at time = 0s (DELAY = ) . The initial voltage is 5V (STARTVAL = 1). Once the pulses start, the pulse length at 0V is 1ms (ONTIME = 1us) and the pulse length at 5V is 0.5 ms (OFFTIME = 0.5us).
Output of Digclock Note that there is no start delay
Vpulse A single pulse (PER = ) that does not start until time = 2ms (TD = 2us) . The initial voltage is 0V (V1 = 0). After the delay, the output rises to 3V (V2 = 3V) in 1ms (TR = 1us), stays at 3V for 3ms (PW = 3us), and then takes 2ms to return back to 0V (TF = 2us).
Voltage signal obtained from the settings on the previous slide for Vpulse Note the start delay of 2μs, the 1μs rise time, and the 2μs fall time
Vpulse Continuous pulses that repeat every 4ms (PER = 4us) that start immediately (TD = 0 ) . The initial voltage is +5V (V1 = 5V). The output drops to -5V (V2 = -5V) in 0ms (TR = 0), stays at -5V for 1ms (PW = 1us), and then return back immediately (TF = 0) to +5V.
Not quite what is expected! There appears to be a rise and fall time (TR and TF, respectively) that is used by PSpice even when you set these values to 0s. This results from the use of the default Step Ceiling when setting the parameters for the Transient Analysis.
More abrupt transitions between 0V and 5V can be obtained if you specify a Step Ceiling that is a small fraction of the period of the voltage signal.
Adding a DC source to Vpulse Setting DC to 2V allows you to add a DC Sweep to the simulation without having to include a Vdc into the schematic. This DC source is only used in the DC Sweep and does not cause a voltage offset to be added to the pulse when performing a transient analysis. Pulse attributes in this case are continuous pulses that repeat every 1ms (PER = 1us) that start immediately (TD = 0 ) . The initial voltage is 0V (V1 = 0V). The output rises to 5V (V2 = 5V) in 0ms (TR = 0), stays at 5V for 0.5ms (PW = 0.5us), and then return back immediately (TF = 0) to 0V.
After selecting DC Sweep in addition to Transient in the Simulation Setup and then running the simulation, you can select which output is plotted by clicking on the DC or Transient in the Analysis Type pop-up window.
When Transient is selected, the 2V DC value entered as an attribute in the Part Name pop-up window does not cause an DC offset voltage.
The value of DC entered as an attribute in the Part Name pop-up window is overridden by the Start Value and End Value that you enter in the DC Sweep pop-up window that is launched when you select DC Sweep in the Analysis Setup pop-up window. However, you must enter some value for DC in the Part Name pop-up window to have the DC Sweep option enabled. Similarly, you must enter some value for AC in the Part Name pop-up window to have the AC Sweep option enabled during the simulation run.