Download
1 / 1
10 likes | 146 Views
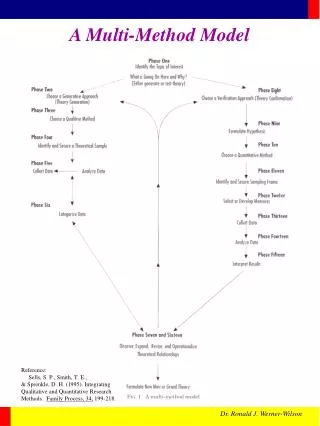
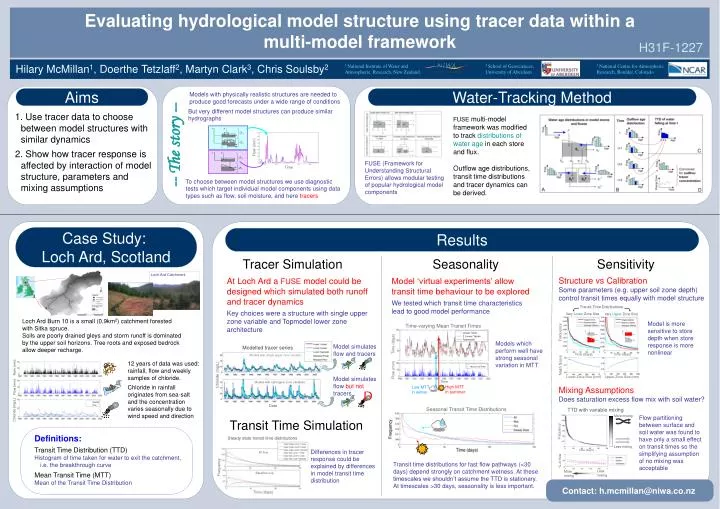
e. p. e. p. Definitions: Transit Time Distribution (TTD) Histogram of time taken for water to exit the catchment, i.e. the breakthrough curve Mean Transit Time (MTT) Mean of the Transit Time Distribution. All flow. Frequency. Baseflow only. Time (days).

E N D
e p e p Definitions: Transit Time Distribution (TTD) Histogram of time taken for water to exit the catchment, i.e. the breakthrough curve Mean Transit Time (MTT) Mean of the Transit Time Distribution All flow Frequency Baseflow only Time (days) Evaluating hydrological model structure using tracer data within a multi-model framework H31F-1227 Hilary McMillan1, Doerthe Tetzlaff2, Martyn Clark3, Chris Soulsby2 1 National Institute of Water and Atmospheric Research, New Zealand. 2 School of Geosciences, University of Aberdeen 3 National Centre for Atmospheric Research, Boulder, Colorado Aims Water-Tracking Method Models with physically realistic structures are needed to produce good forecasts under a wide range of conditions But very different model structures can produce similar hydrographs • Use tracer data to choose between model structures with similar dynamics • Show how tracer response is affected by interaction of model structure, parameters and mixing assumptions FUSE multi-model framework was modified to track distributions of water age in each store and flux. Outflow age distributions, transit time distributions and tracer dynamics can be derived. -- The story -- Flow (mm) FUSE (Framework for Understanding Structural Errors) allows modular testing of popular hydrological model components Time To choose between model structures we use diagnostic tests which target individual model components using data types such as flow, soil moisture, and here tracers Case Study: Loch Ard, Scotland Results Tracer Simulation Seasonality Sensitivity Loch Ard Catchment Structure vs Calibration Some parameters (e.g. upper soil zone depth) control transit times equally with model structure At Loch Ard a FUSE model could be designed which simulated both runoff and tracer dynamics Key choices were a structure with single upper zone variable and Topmodel lower zone architecture Model ‘virtual experiments’ allow transit time behaviour to be explored We tested which transit time characteristics lead to good model performance Transit Time Distributions Vary Lower Zone Size Vary Upper Zone Size Loch Ard Burn 10 is a small (0.9km2) catchment forested with Sitka spruce. Soils are poorly drained gleys and storm runoff is dominated by the upper soil horizons. Tree roots and exposed bedrock allow deeper recharge. Model is more sensitive to store depth when store response is more nonlinear Time-varying Mean Transit Times Frequency Linear Tank 2 Linear Tanks Topmodel Models which perform well have strong seasonal variation in MTT Time (days) Model simulates flow and tracers Modelled tracer series Time (days) Time (days) Models with single upper zone variable i i 12 years of data was used: rainfall, flow and weekly samples of chloride. Chloride in rainfall originates from sea-salt and the concentration varies seasonally due to wind speed and direction Nash Score Rain (mm) Measured Flow Flow (mm) Chloride (mg/L) Lower Zone Size (mm) Upper Zone Size (mm) Model simulates flowbut not tracers Time Models with split upper zone variables High MTT in summer Low MTT in winter Mixing Assumptions Does saturation excess flow mix with soil water? Flow (mm) D i Date Seasonal Transit Time Distributions TTD with variable mixing Chloride (mg/L) More mixing Flow partitioning between surface and soil water was found to have only a small effect on transit times so the simplifying assumption of no mixing was acceptable Transit Time Simulation Frequency Steady state transit time distributions Less mixing Time (days) Differences in tracer response could be explained by differences in model transit time distribution % of flow Transit time distributions for fast flow pathways (<30 days) depend strongly on catchment wetness. At these timescales we shouldn’t assume the TTD is stationary. At timescales >30 days, seasonality is less important. Less mixing More mixing Contact: h.mcmillan@niwa.co.nz