Download
1 / 7
70 likes | 212 Views
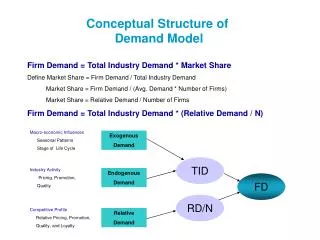
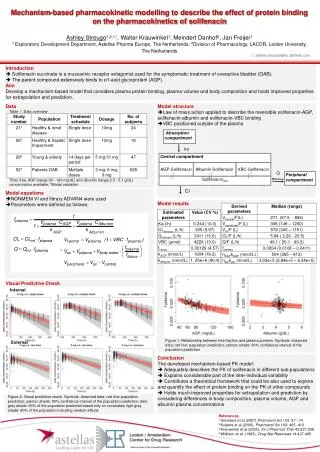
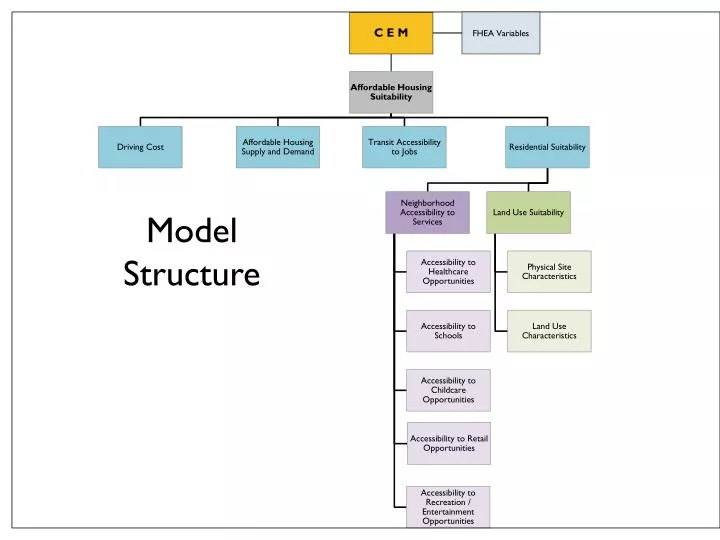
FHEA Variables. Model Structure. Pre-SunRail. Post-SunRail. Existing model inputs land uses employment locations LYNX transit system. New model inputs future land uses in station areas employment locations LYNX + SunRail. Changes to Driving Cost Affordable Housing Demand

E N D
FHEA Variables Model Structure
Pre-SunRail Post-SunRail • Existing model inputs • land uses • employment locations • LYNX transit system • New model inputs • future land uses in station areas • employment locations • LYNX + SunRail Changes to Driving Cost Affordable Housing Demand Transit Accessibility to Jobs Two Scenarios
Residential Suitability Neighborhood Accessibility to Services Neighborhood Accessibility Healthcare Schools Childcare Retail Recreation & Entertainment
Residential Suitability Land Use Suitability Physical Site Characteristics Land Use Characteristics Soils Land Values Flooding Growth Hazardous Sites Infill Potential Air polluters Noise Generators
Visualize Scenario using CEM • Each column represents one of the information layers • Each row represents a unique combination of the layers
Visualize Scenario using CEM • Build “table queries” that best fit assumptions Example - find locations with high residential suitability that also have low driving cost, high transit access to jobs, and are located in areas with an under-supply of affordable units. RES_SUIT >= 20 AND DRIVE_COST >=20 AND TRAN_ACC >= 20 AND SUPPLY_DEM <=1.0 Table Query
Residential Suitability Fair Housing and Equity FHEA Measurements Racially Concentrated Areas of Poverty Racial / Ethnic Dissimilarity Index Fair Share Affordable Housing Index