Download
1 / 16
160 likes | 288 Views
Changes in Vegetation Dynamics in Alaska: Implications for Arctic Herbivores Eugénie Euskirchen Wildlife Response to Environmental Arctic Change Workshop Nov. 17 -18, 2008. Pan-Arctic Detection of Recent Land Surface Changes. ≤ -3.0. <-0.4. -2.0. -0.4. -1.0. -0.3. -0.2. Days

E N D
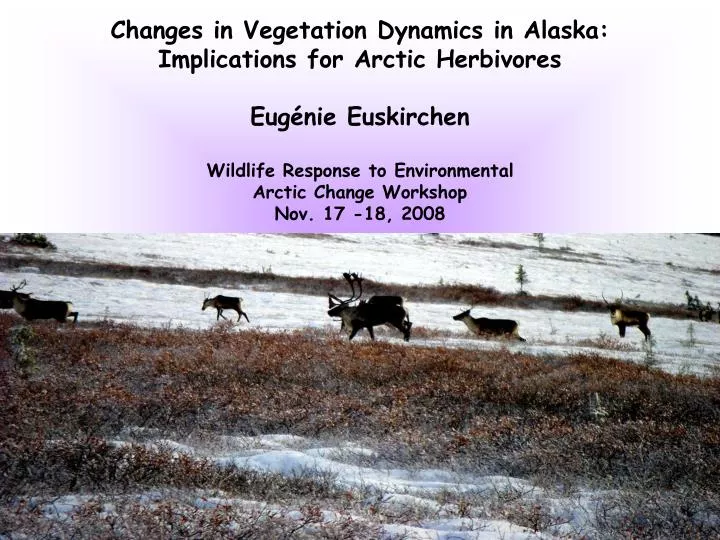
Changes in Vegetation Dynamics in Alaska: Implications for Arctic Herbivores Eugénie Euskirchen Wildlife Response to Environmental Arctic Change Workshop Nov. 17 -18, 2008
Pan-Arctic Detection of Recent Land Surface Changes ≤-3.0 <-0.4 -2.0 -0.4 -1.0 -0.3 -0.2 Days shorter yr-1 0.1 >0.1 Days shorter yr-1 -0.05 0.0 1.0 Days longer yr-1 Days longer yr-1 2.0 ≥3.0 Change in Snow Cover Duration 1970 - 2000 Change in Gross Primary Productivity 1982 - 2003 Growing Season Change 1988 - 2000 Euskirchen et al., Global Ch. Biol., 2007 McDonald et al., Earth Interactions, 2004 Bunn & Goetz, Earth Interactions, 2006
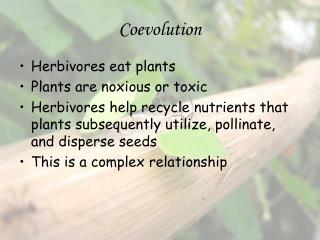
Increased shrubiness Changes in fire regimes Increases in insect outbreaks Sturm et al., 2001; 2005 Suarez, 1999; Lloyd & Fastie, 2003 Treeline advance Studies have also documented changes in plant community composition at high-latitudes
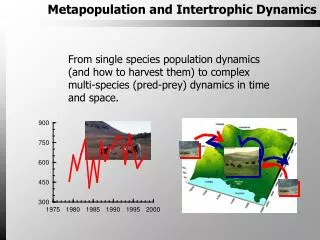
Changes in the length of the snow & growing seasons impact vegetation. • How well can we predict these changes in vegetation? (TEM-DVM) • What is the magnitude of climate-related changes in the productivity of the major ecosystem types (including their dominant plant functional types, PFTs) in northern Alaska? • How can we use predictions in vegetation changes to gain an understanding of how herbivores may be impacted by predicted changes in vegetation? (TEM-DVM linked to CARMODEL) • What types of processes / dynamics and habitats do vegetation models need to consider?
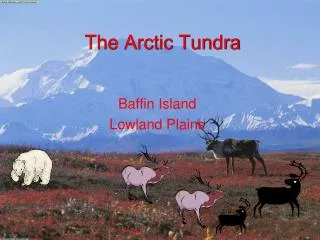
Spruce, Salix spp., other deciduous shrubs, evergreen shrubs not including spruce, sedges, forbs, lichens, and feathermoss Tussock tundra Spruce forest Willow-birch tundra Betula spp., other deciduous shrubs, evergreen shrubs, sedges, forbs, lichens, feathermoss and Sphagnum moss Salix spp., Betula spp., other deciduous shrubs evergreen shrubs, sedges, forbs, lichens, & feathermoss
TERRESTRIAL ECOSYSTEM MODEL WITH DYNAMIC VEGETATION AND LEAF, WOOD, AND ROOT COMPONENTS (TEM-DVM) Atmospheric Carbon Dioxide (CO2) RH Light NAV Light NAV NETNMIN SOIL NS NLOST CS NINPUT NAV Linked to other submodels including a soil thermal model (permafrost dynamics; Zhuang et al., 2001) and hydrology model (snow dynamics; Euskirchen et al., 2007) Euskirchen et al., in press, Ecol. Applications
The study region in northern Alaska is classified as 77% sedge tundra, 13% shrub tundra, • and 8% evergreen needleleaf forest, with each of these ecosystems comprised of 8 or 9 PFTs. • The model is parameterized based on field • data collected in the study region.
We used a wide range of future climate scenarios, based on the IPCC SRES scenarios and three global climate models (GCMs). Shown below is input air temperature data. Mean annual MAM JJA SON DJF Change in air temperature (°C year-1) A2 PCM B1 Had. CM3 B2 Had. CM3 Mean B1 PCM A2 Had. CM3 B2 PCM B1 CSIRO A2 CSIRO B2 CSIRO
Change in NPP (2003 – 2100) across all ecosystem types and PFTs, arranged in descending order. 230 155 115 75 35 -5 Forest Shrub tundra Sedge tundra Change in NPP, 2003-2100 (g C m-2) (Shrub) (Sedge) (Forest) (Shrub) Salix Sedge Feather Salix Decid. Feather Forb Feather Sphag. Forb Sedge Spruce Forb Grass Sedge Lichen Betula Grass Decid. Decid. Lichen E.green Lichen E.green Betula E.green Euskirchen et al., in press, Ecol. Applications
Shrub Tundra 2003 - 2100 6 400 5 300 4 3 200 2 100 1 0 0 Salix Decid. Decid. Betula Betula Forbs Forbs Salix Evergr. Evergr. Lichens Lichens Sedges Sedges Grasses Grasses Feather. Feather. Change in Vegetation Carbon Change in Vegetation Nitrogen Vegetation N change (g N m-2) Vegetation C change (g C m-2)
Sedge tundra Regional Shrub tundra Summer Albedo Forest Increases in NPP resulted in increases in biomass, and consequently, decreases in summer albedo. The albedo of the shrub tundra is approaching that of the forest at the end of the simulation. Can the shrub tundra ecosystem still be a considered shrub tundra ecosystem?
How can TEM-DVM be used to relate vegetation changes to herbivores? • Arctic calving caribou provide an example of a species that is likely to be affected by climate change, but with long annual migrations and a circumpolar distribution the effects on populations will not be uniform. • An explicit energetics model (CARMODEL) is available that allows assessment of projected climate induced changes in potential forage intake on fat and protein dynamics.
CARMODEL (Russell et al., 2005) • Future climate: • Air temperature • Precipitation • Solar radiation Energy Submodel Forage • Biomass of a PFT • Digestibility • Cell wall content • Nitrogen content • Diet Daily forage intake Hourly digestion Daily Rumen contents Daily Next hour Snow depth Growth Submodel Activity budgets Daily Daily Energy Allocation • Maintenance • Activity • Gestation • Lactation Yearly Reproductive strategy Daily Growth of Cow & Calf • Conception date • Gestation period • Wean date Cow weight Energetics Model Next day
Compare and contrast the implications of climate induced changes in forage biomass and quality on fat and protein dynamics in two groups of caribou with characteristically different diets at calving: a) caribou that calve in the wetter portions of the coastal plain (Central Arctic, Teshekpuk), and b) caribou that calve in uplands and drier portions of the coastal plain (Western Arctic, Porcupine). • Analyses based on a range of climate scenarios will allow managers and subsistence users to more effectively understand the range of possible future conditions and to plan adaptation strategies.
Integration of the model presented here (TEM-DVM) with other land cover maps / habitat classification schemes: • Finer scale representation of the ecosystem types within a landscape or region is possible. • It is also possible to incorporate other ecosystem/habitat types than the three presented earlier. • Some parameterization data for PFTs in a given habitat type is necessary. • One recent model development is a dynamic soil layer module (Yi et al., manuscript in prep.) that incorporates different types of soil layers (e.g., live moss, humic, fibric) and drainage classes (e.g., moderately well-drained, poorly drained). 1 km X 1 km
Future Work & Challenges: • Incorporating shifts from one ecosystem type to another • Incorporating changes in vegetation (at the ecosystem & PFT level) under changes in the fire regime and insect outbreaks • Understanding how the phenology of the various PFTs responds to changes in growing season length in terms of both budburst in the spring and leaf senescence in the fall • Incorporating water competition among the PFTs • Increased levels of herbivory may lead to increases in productivity of ecosystems under climate change. How then does this increased herbivory feed back on the ecosystem? Field experiments suggest that the increased herbivory will ultimately modulate this increased productivity (e.g., Sjögersten et al., 2008).