Download
1 / 11
110 likes | 266 Views
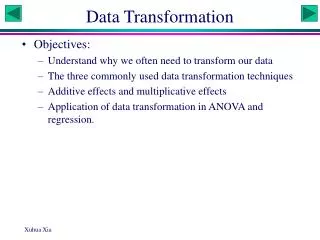
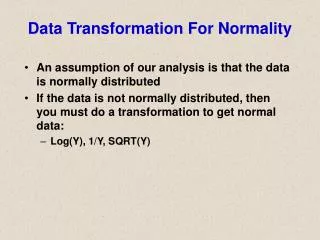
Data Transformation for autocorrelated baselines in Single System Designs. Examples First Difference Transformation (FDT) Moving Averages Transformation (MAT). The FDT Method. Subtract the 1 st point from the 2 nd Subtract the 2 nd point from the 3 rd Subtract the 3rd point from the 4 th

E N D
Data Transformation for autocorrelated baselines in Single System Designs Examples First Difference Transformation (FDT) Moving Averages Transformation (MAT)
The FDT Method • Subtract the 1st point from the 2nd • Subtract the 2nd point from the 3rd • Subtract the 3rd point from the 4th • Continue this pattern until all points are subtracted • Select a constant that will make all the data point greater than zero (s > 0). • Add each constant to each data point • Test for autocorrelation • If NOT autocorrelated use the FDT method on the treatment data set • Plot the new data set on a graph and use a statistic.
The MAT Method • Add point 1 and point 2 • Divide the sum by 2 • Add point 2 and point 3 • Divide the sum by 2 • Add point 3 and point 4 • Continue this pattern until all points are added and divided • Test for autocorrelation • If NOT autocorrelated use the MAT method on the treatment data set • Plot the new data set on a graph and use a statistic.