Download
1 / 16
160 likes | 255 Views
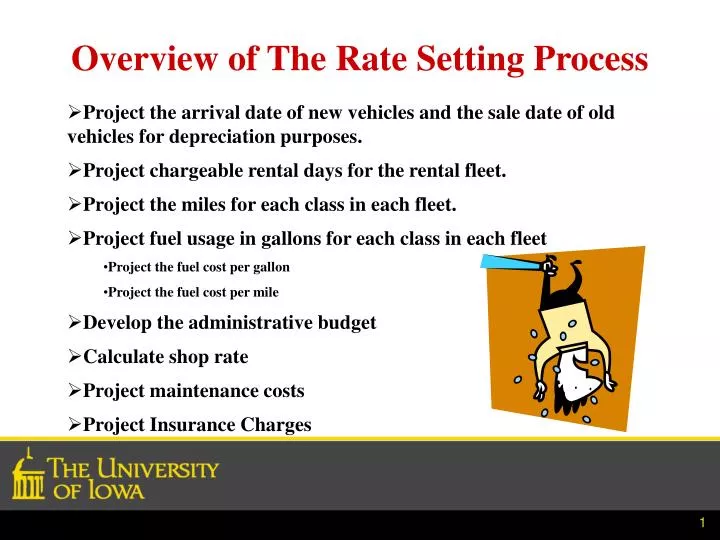
Overview of The Rate Setting Process. Project the arrival date of new vehicles and the sale date of old vehicles for depreciation purposes. Project chargeable rental days for the rental fleet. Project the miles for each class in each fleet.

E N D
Overview of The Rate Setting Process • Project the arrival date of new vehicles and the sale date of old vehicles for depreciation purposes. • Project chargeable rental days for the rental fleet. • Project the miles for each class in each fleet. • Project fuel usage in gallons for each class in each fleet • Project the fuel cost per gallon • Project the fuel cost per mile • Develop the administrative budget • Calculate shop rate • Project maintenance costs • Project Insurance Charges
Overview of The Rate Setting Process • Two Pieces of the Rate: • Fixed Costs (Costs that stay the same no matter how much the vehicle is used) • Depreciation, Insurance, Admin, Interest, • Variable Costs (Costs that change as the vehicle is used) • Fuel, Maintenance
Project the arrival date of new vehicles and the sale date of old vehicles for depreciation purposes Average Total Monthly Depreciation / Average Fleet Size = 2815.76/17.3 = $162.76/Month/Vehicle
Calculate Chargeable Days per Month per Vehicle • From depreciation table we know average fleet size of 17.3 • From Chargeable Days table we projected 2481.39 chargeable days for the year • Now we calculate Chargeable Days/Vehicle/Month • 3733/12/17.3 = 17.98
Project Fuel Usage in Gallons for Each Class in Rental Fleet MPG/Miles = Gallons of Projected Fuel Use But is that the end? NO !! The components of each type fuel must be projected. Bio-diesel Ethanol #1 Diesel #2 Diesel Credit Card Fuel Flow Improver
To Project Cost of Diesel Fuel For Diesel Project the Cost per gallon of # 1, #2, Flow Improver, and Bio-diesel
Develop and Allocate Administrative Budget • Allocation to Rental/Lease Fleet • 38.3% to Rental Fleet ($188,410) • 61.7% to Lease Fleet ($303,521) • Customer Cost • Total Cost/Total Fleet Size/12 months/Rental Days per Month • $188,410/59.2/12/17.98= $14.75/day (For MS Sedan)
Calculate Shop Rate Divide Shop Admin Budget by Chargeable Hours
Project Maintenance Costs Shop Labor Hours, Shop Parts, Sublets by Class
Maintenance Cost to Customer • For MS Sedan: Sublet Costs: $13,958 Shop Hours * Shop Rate: 519 Hours * $86/hr = $44,634 Parts Cost: $18,381 Total Maintenance Cost = $76,973 Cost/Mile = $76,973 / 1,039,233 miles = $0.074/mile for maint.
Project Insurance Costs • Monthly Insurance Rate at UI is $39 • Deductible is $500/accident ($6/Month) $41/17.97 Chargeable days /Month = $2.28/day Don’t you hate it when one fleet vehicle hits another? 2 Deductibles!!
Putting it All Together for a Rental Rate • Fixed Cost Portion of Rate: • Average Depreciation ($162.76/17.97) = $9.06 + • Administrative Cost = $14.75 + = $26.09/day • Insurance Cost = $2.28 • Variable Cost Portion of the Rate: • Maintenance Expense ($0.074/mile) + • Fuel Expense ($0.082/mile) = $0.16/mile