Download

1 / 8
80 likes | 217 Views
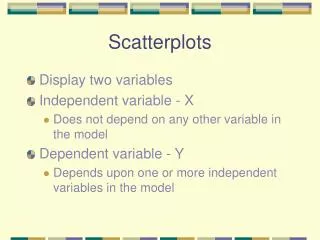
Scatterplots. Application 6.1. Take 5 minutes to finish the application on page 357. Then we will go over what your responses are. . Guess the correlation. For the following pairs of variables, would you expect a substantial negative correlation, positive correlation, or a small correlation?

E N D
Application 6.1 • Take 5 minutes to finish the application on page 357. • Then we will go over what your responses are.
Guess the correlation • For the following pairs of variables, would you expect a substantial negative correlation, positive correlation, or a small correlation? • The age of secondhand cars and their prices. • The weight of new cars and their gas mileage. • The heights and weights of adult men. • The heights and IQ scores of adult men. • Heights of daughters and the heights of their mothers.
Will stocks go up or down? • Lets read page 363 in the blue box together. It’s about stocks being predicted using the Super Bowl as an indicator.
Activity 6.2 Vitruvius and the Ideal Man • Read as a class the first paragraph on page 364.
1. Measure the distance from the elbow to the tip of the hand and the height for each group member to the nearest inch. Record your data. • 2. As a class, we will gather all of the measurements.
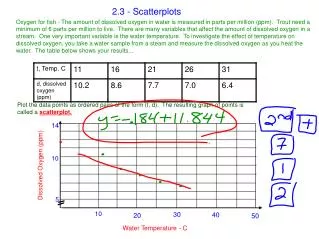
3. Make a scatterplot of all of the data. Use the distance from the elbow to the tip of the hand as the explanatory variable. • 4. Describe the direction, form, and strength of the relationship. Estimate the correlation. • 5. Enter your data into the calculator. Pull up a scatterplot and see if yours is the same (change the window as needed).
6. According to Da Vinci, the distance from the elbow to the tip of the hand should be one-fifth of the height. That is, the height should be five times the distance measured on the arm. • 7. Type into y = 5x and hit graph. What do you see? • 8. Based on your graph, make a prediction for the height of a student whose distance measured on the arm is 10 inches.